The two-sample Z-test by hand
The two-sample Z-test is used to compare the means of two different samples, when you know the population standard deviation and your sample size is larger than 30 individuals.
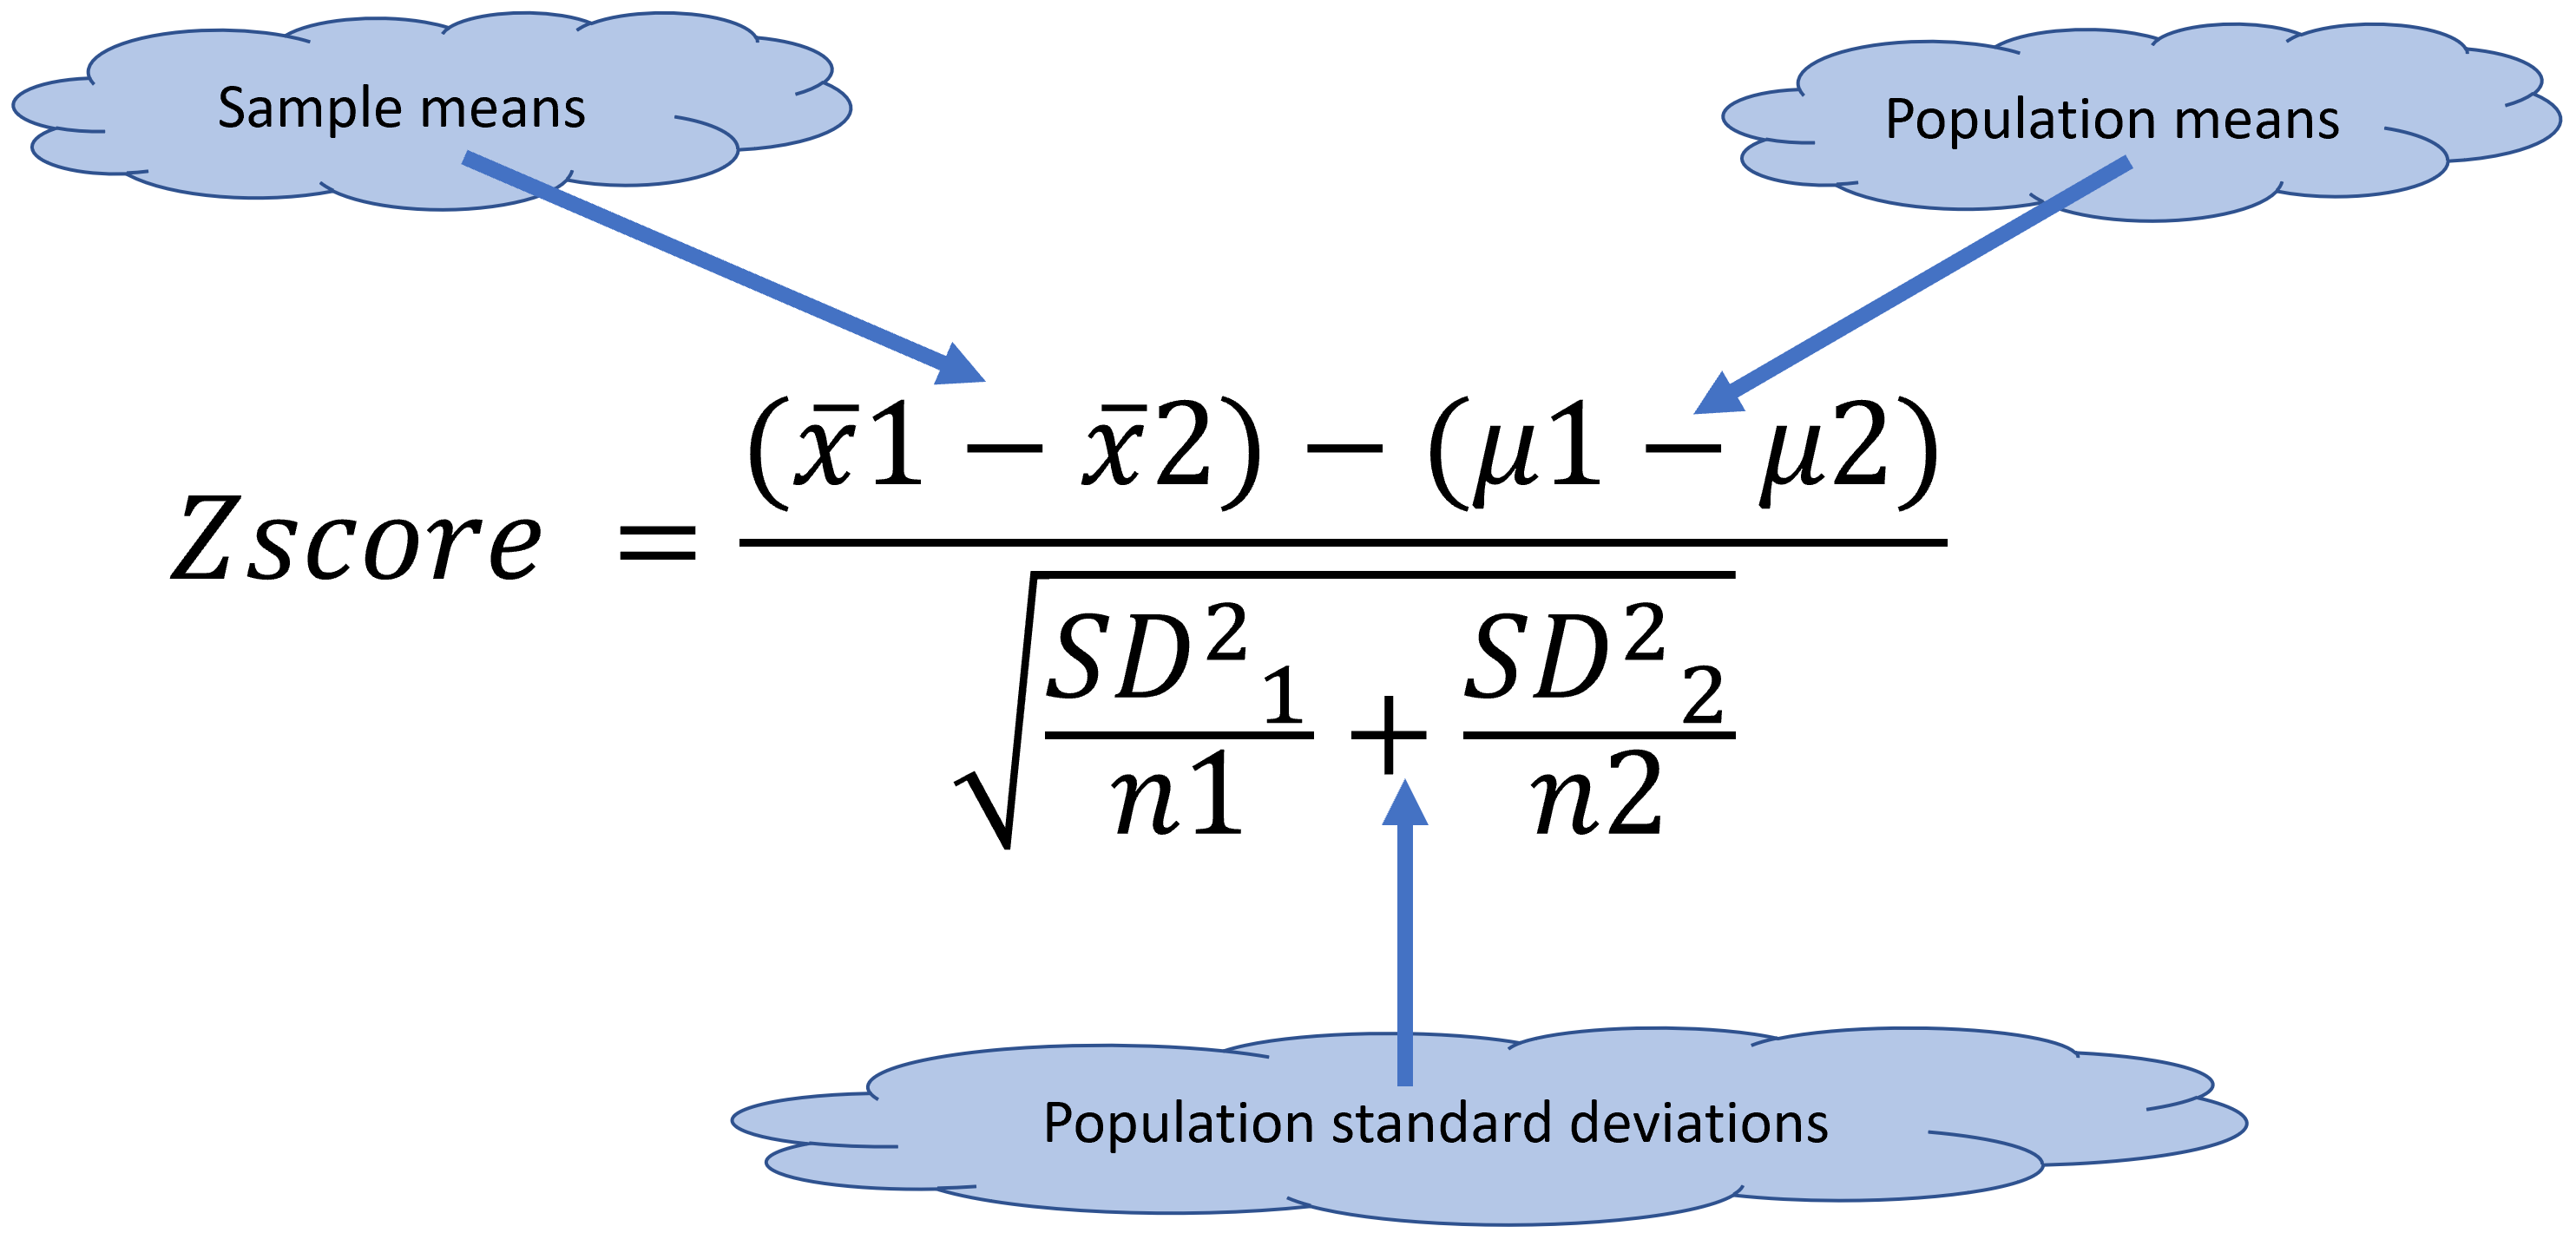
Figure 11.3: Z-test fucntion for two samples
Lets try an example.
A researcher wants to determine if a given drug is any different than a placebo at affecting physical endurance (i.e, the time it takes to do 20 push-ups).
Nine hundred subjects are given the drug prior to testing, whereas 1000 other subjects receive a placebo.
For the drug group, it took 9.78sec on average (S.D. = 4.05) to do 20 push-ups, whereas the placebo group took 15.10sec on average (S.D. = 4.28).
Does this drug has any effect on physical performance? Let’s test this hypothesis at an \(\alpha\) of 0.05,or 5%.
Lets start by visualizing these data:
Drug_Mean=9.78
Drug_SDSD=4.05

Placebo_Mean=15.10
Placebo_SD=4.28

SimulatedDrug<- rnorm(10000,Drug_Mean,Drug_SDSD)
SimulatedPlacebo<- rnorm(10000,Placebo_Mean,Placebo_SD)

breaks = seq(-20,40, length.out = 50) #bins for the distribution

#histogram for drug
Drug= hist(SimulatedDrug, xlim=c(-20,40),ylim=c(0, 500),breaks = breaks,  plot = FALSE)

#histogram for Placebo
Placebo= hist(SimulatedPlacebo, xlim=c(-20,40),ylim=c(0, 500),breaks = breaks,  plot = FALSE)


#because you are plotting two distributions, it will be nice to use different colors. and because they likely overlap, you should use semitransparent colors
LightBlue <- rgb(173,216,230,max = 255, alpha = 100) #the function rgb lets your select one color, and the alpha gives you how transparent
DarkRed <- rgb(255,192,203, max = 255, alpha = 95)


#lets plot the first distribution
plot(Drug, main=NA,xlim=c(-20,40),ylim=c(0, 1500),breaks = breaks, xlab = "Time to do 20 push-up (Seconds)",ylab = "Number of people" ,col=LightBlue)

#now add the second distribution to the first plot, using the parameter add=TRUE, or add=T, theya re both the same
plot(Placebo, add=T ,col=DarkRed)  #note how for the parameter col, you indicate the color you create as a variable above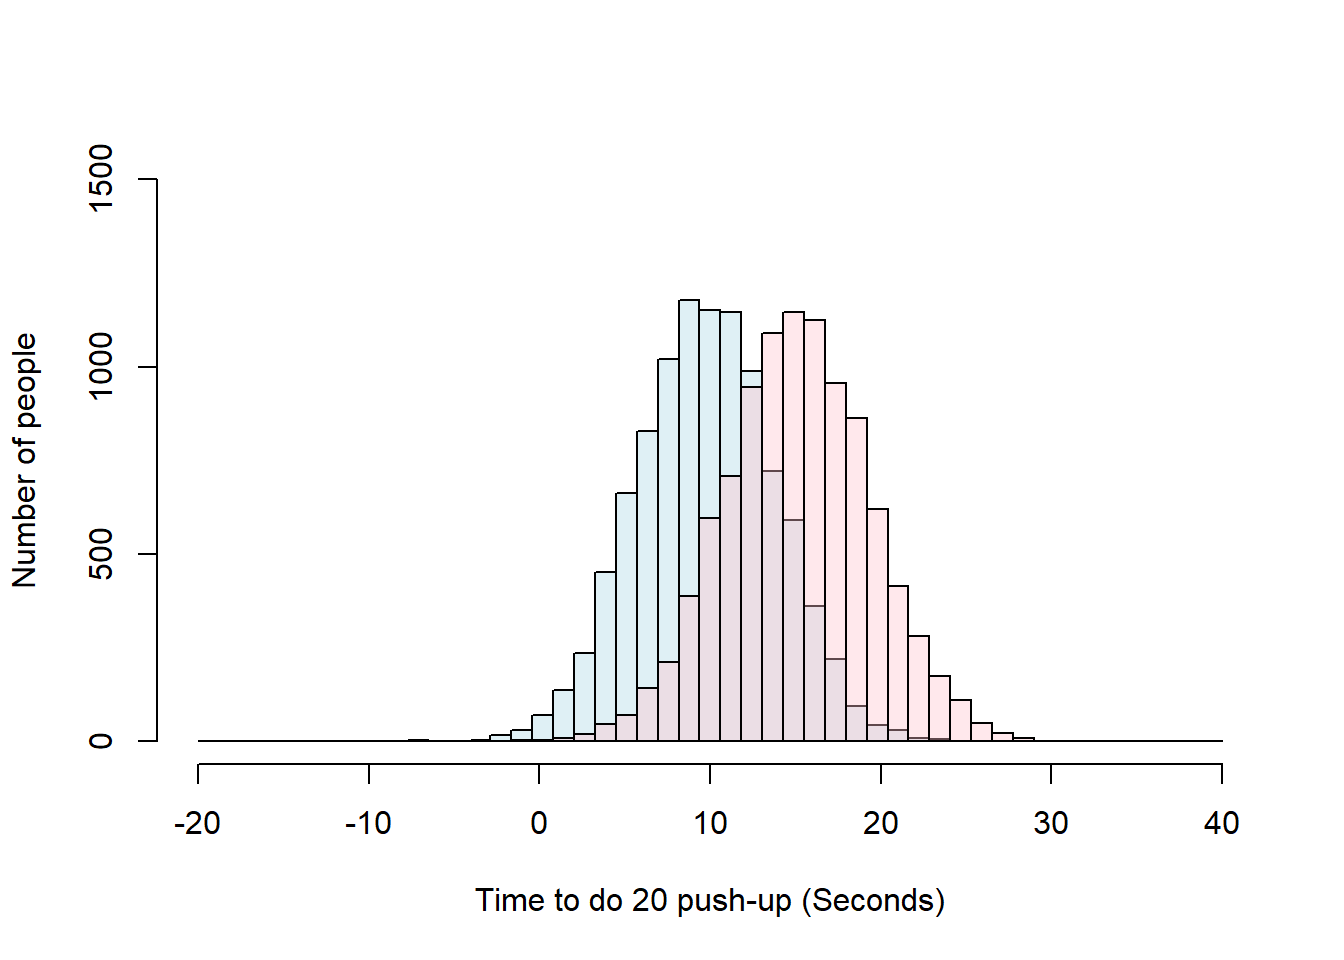
Lets state the hypotheses:
H0: Drug performance time = placebo time The null hypothesis is that the two groups take the same time.
H1: Drug performance time \(\neq\) placebo time The alternative hypothesis is that they are different.
If you read carefully the question, you will see that the motivation of the researcher was to see if the drug was “any different”. I did that on purpose, so you can state the alternative hypothesis accordingly.
Perhaps a better statement could be that the drug is better, in which case the null hypothesis would be greater than, in which case we would need a right-hand test, as oppose to a two-tail test when we asked is they are different. When it comes to statistics, and most things in life, you always do what is written, as that is your supporting evidence.
So what test do we use?. Well, the sample size is larger than 30, so a Z-test seems appropriated.
Lets calculate the Z-score for comparing two samples
Drug_Mean=9.78
Drug_SDSD=4.05
Drug_n =900   #sample size for the drug treatment

Placebo_Mean=15.10
Placebo_SD=4.28
Placebo_n=1000 #sample size for the placebo treatment


Z_Score_Numerator= (Drug_Mean-Placebo_Mean) -0  #because we assume that the two treatments have the same effect, we then have to assume that the difference between the population means is zero.

Z_Score_denominator= sqrt(((Drug_SDSD^2)/Drug_n)+((Placebo_SD^2)/Placebo_n))

Z_score=Z_Score_Numerator/Z_Score_denominator
Z_score
## [1] -27.82961By now, we know well that two standard deviations from the mean include 95% of the observations in a normally distributed population. A value that is -27.82 standard deviations away from the mean does not even appear in traditional z-tables, so we can certainly reject the null hypothesis and conclude that this drug is indeed different than a placebo.