ANOVA in R
There are numerous R-packages that allow you to run ANOVAs, lets try a couple:
library(tidyverse)
library(ggpubr)
library(rstatix) # we load this libraries, which we use to sumamrise the results

#We start by putting the data in a dataframe, which two columns. one for the variety type, and the other for the number of tomatoes
Data=data.frame(Variety=c(rep("VarA",3),rep("VarB",3),rep("VarC",3)), NumTomatoes=c(1,2,3, 3,4,5, 5,6,7))

#The ANOVA function is anova_test, which simply requires the response variable (number of tomatoes in our case) equal to the independent variable or factor (Variety of tomatoes in our case)
res.aov <- Data %>% anova_test(NumTomatoes ~ Variety)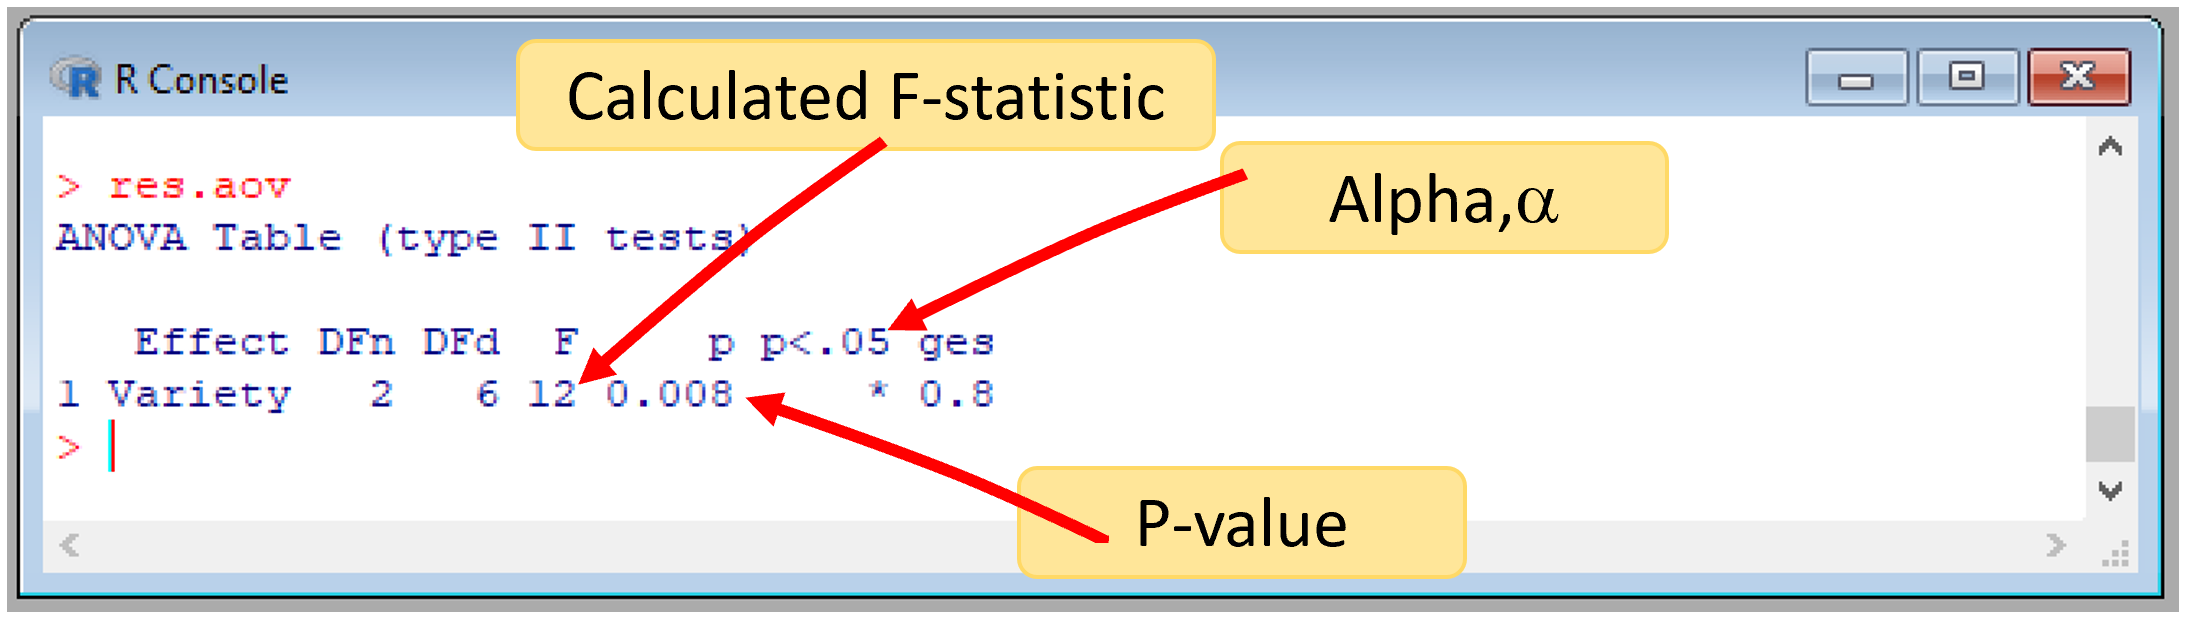
Figure 12.14: Anova in R using anova_test
We can also run an ANOVA in R using the aov function, which is part of the default functions in R.
Data=data.frame(Variety=c(rep("VarA",3),rep("VarB",3),rep("VarC",3)), NumTomatoes=c(1,2,3, 3,4,5, 5,6,7))

aovAnova <- aov(NumTomatoes ~ Variety, data = Data)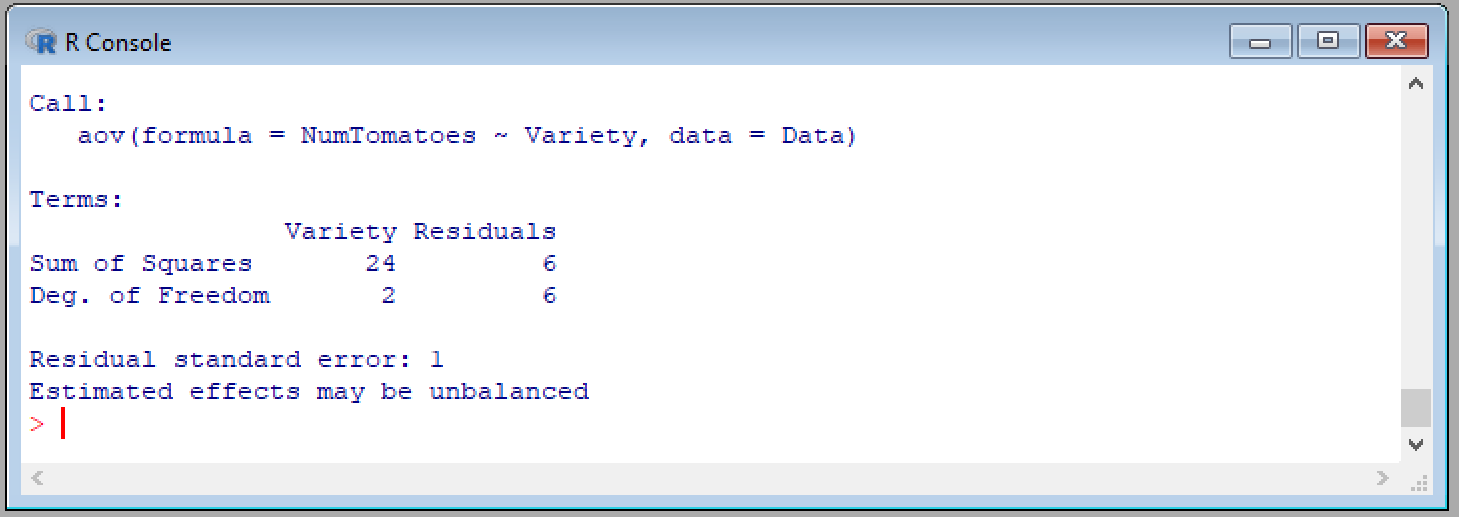
Figure 12.15: Anova in R using aov
You can see a different set of results from the aov function, using the summary function.
Data=data.frame(Variety=c(rep("VarA",3),rep("VarB",3),rep("VarC",3)), NumTomatoes=c(1,2,3, 3,4,5, 5,6,7))

aovAnova <- aov(NumTomatoes ~ Variety, data = Data)
summary(aovAnova)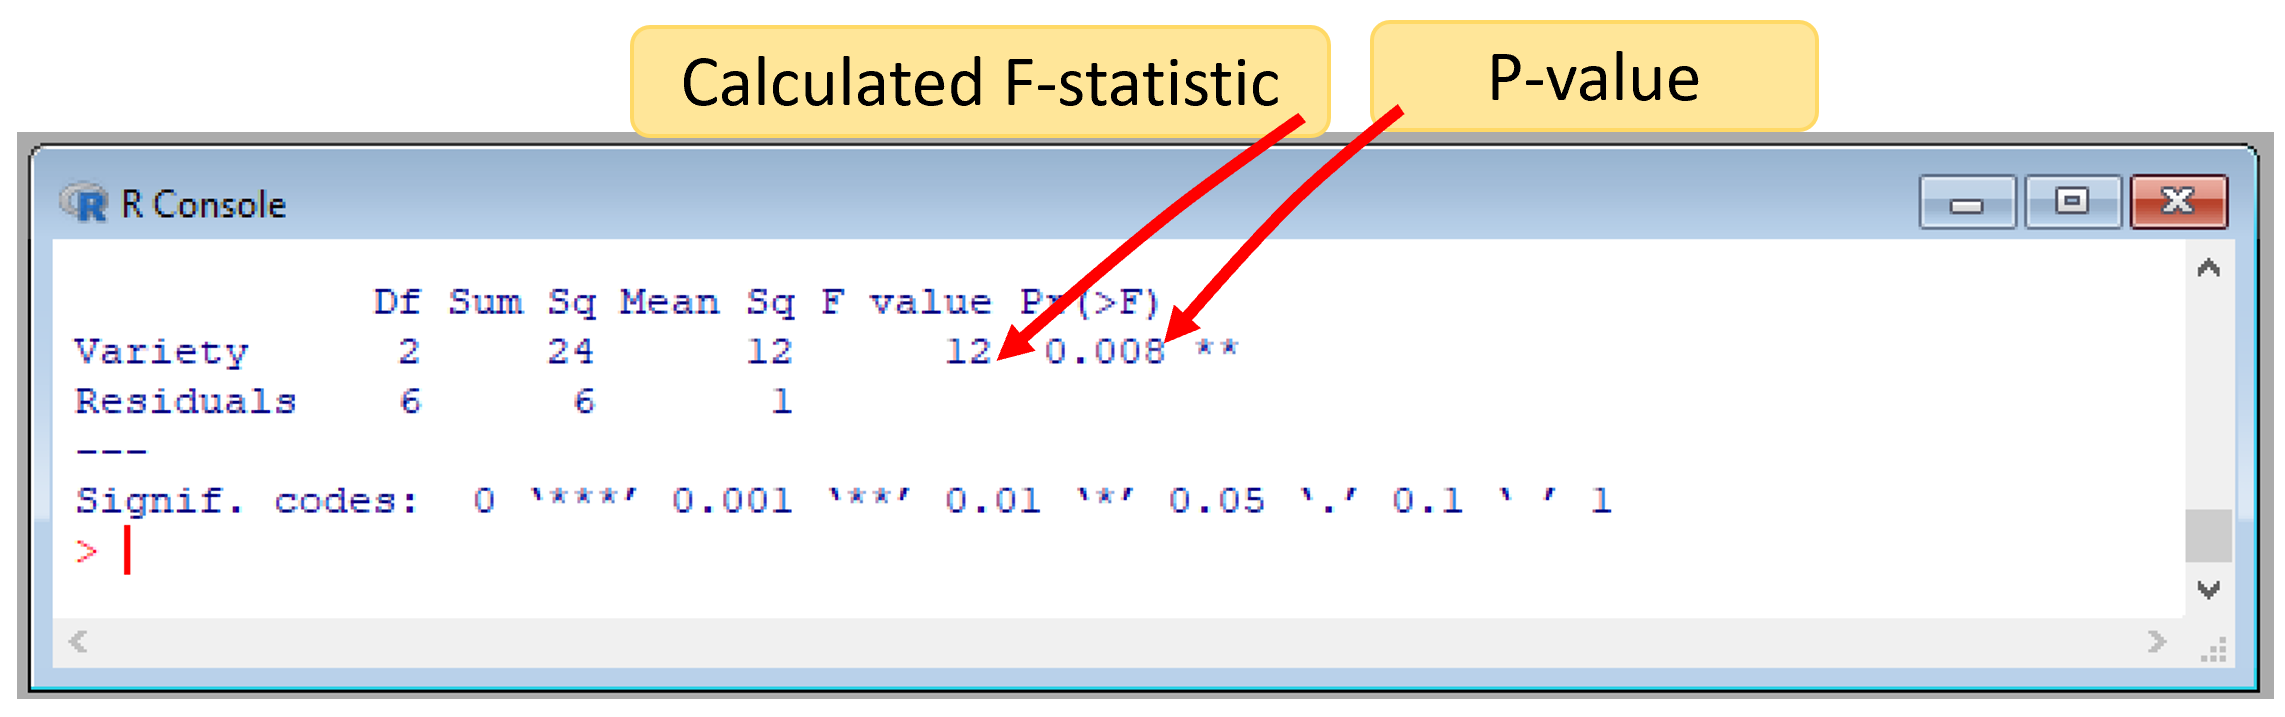
Figure 12.16: Anova in R using aov