Linear regression in R
By now you know the equation of the linear regression model, the idea behind the least-squares approach, and how to calculate and interpret the different elements of the equation.
R can calculate all those equations automatically for you using the lm function, which stands for linear model. The cool think is that you can now interpret the results from that function. Lets try using the data on grades and time studying.
#lets start by bringing back the data
Hours_Studying=c(0.5, 1.8, 2.4, 3.8, 4.5)
Grade=c(55, 64, 75, 82,95)

# the function lm, requires you to simply set the model as y ~ x. In our case, grades are the dependent variable, so it goes on the Y-axis, and time studying is the independent variable, so it goes in the x-axis.
lm (Grade~Hours_Studying)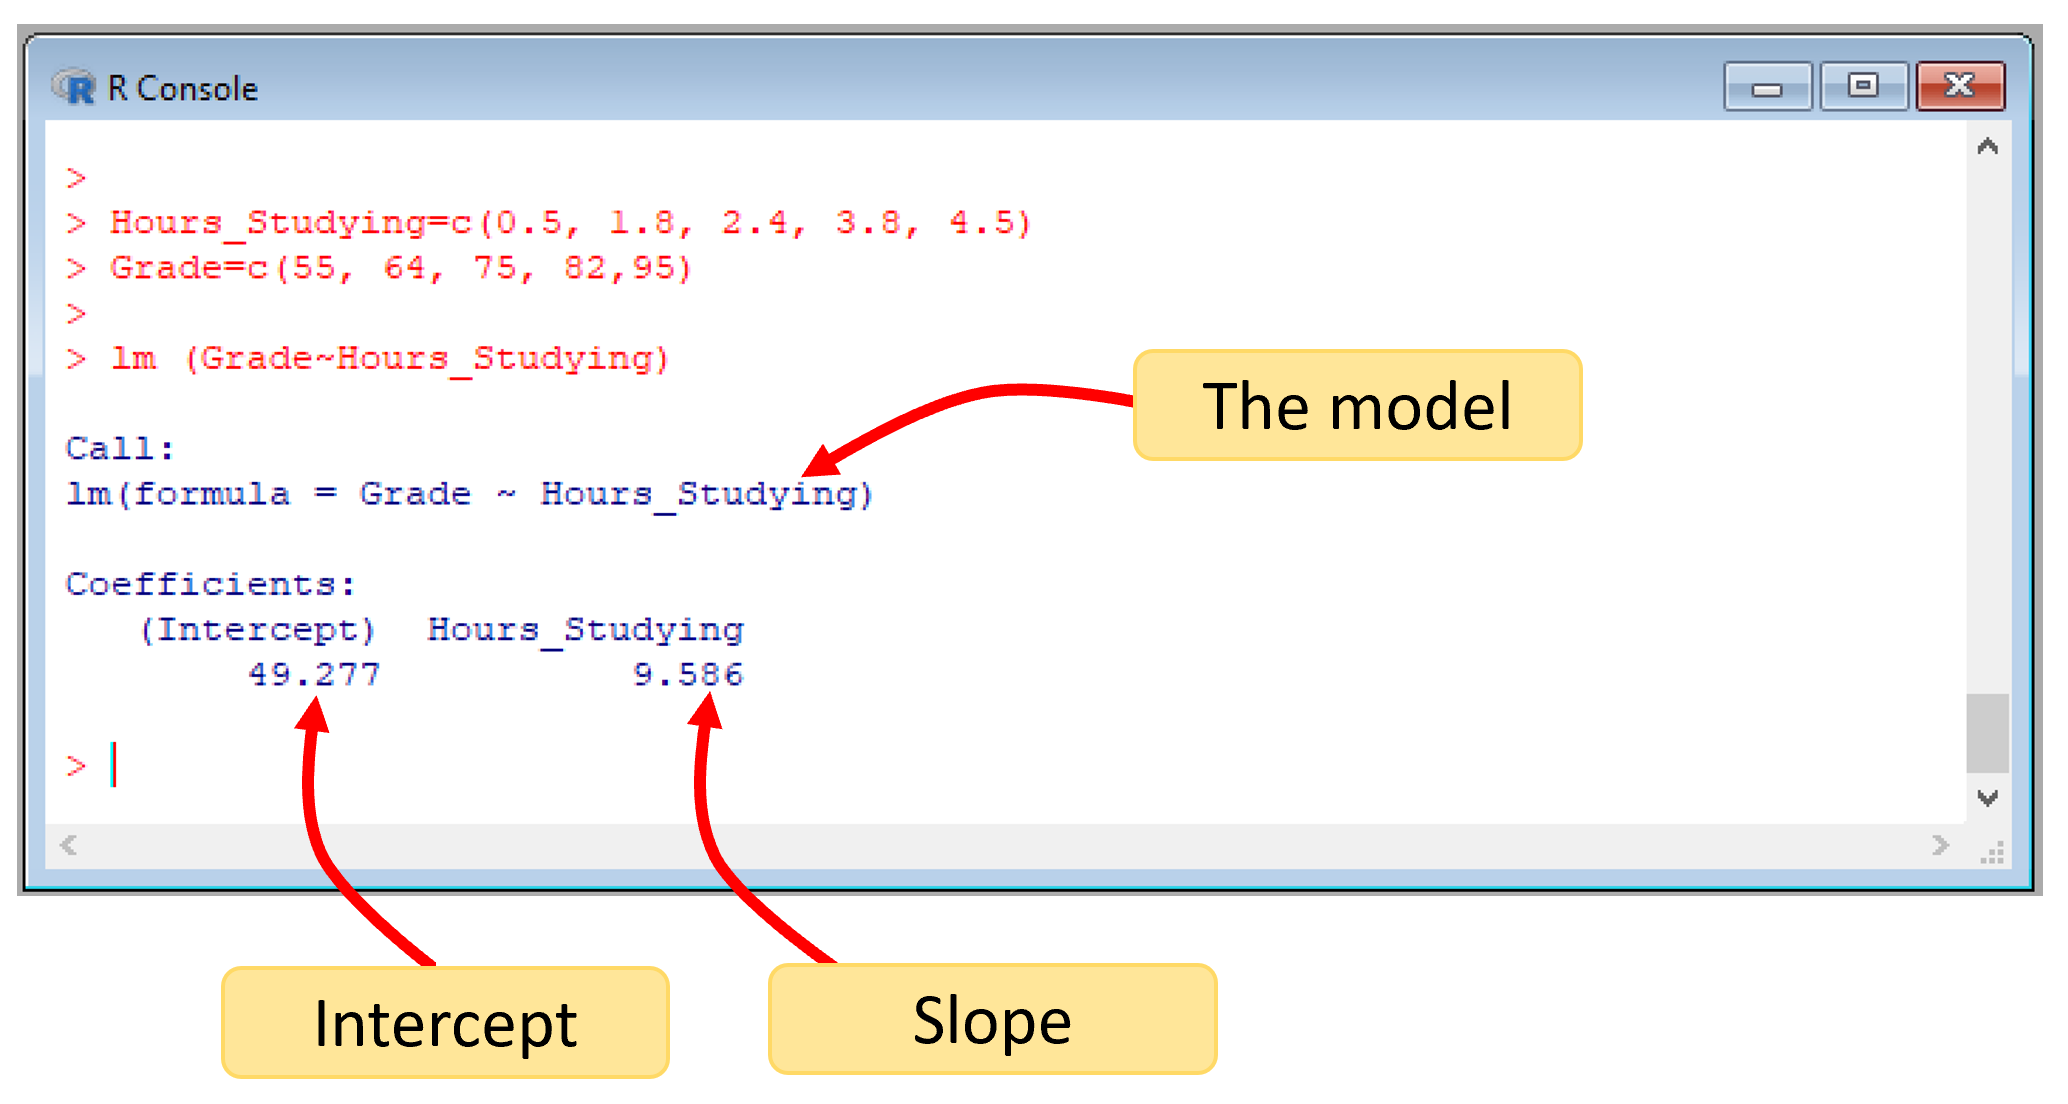
Figure 7.3: Linear regression output in R