Purpuse of the regression line
As indicated earlier, a common name for the intercept is the lowercase letter \(b\) and a common name for the slope is the lowercase letter \(m\), in the regression model they come together as:
\[\begin{equation} Y = mX + b \end{equation}\]
The beauty of the regression model above is that by knowing \(m\), and \(b\), you can predict any value of Y, if you know X.
Say there is a relationship between years of higher education and salary, which is well defined with a regression equation with an intercept of $25,000 and a slope of $10,000 dollars/year. Given the units given, you should predict that salary is in the Y-axis and years of education in the X-axis. I can turn that into the equation, like:
\[\begin{equation} Salary = 10,000 * \text{(Years Of Education)} + 25,000 \end{equation}\]
I can also display, that line in an XY plot, using the abline function:
#plot first
plot(0, 0,xlab="Years of education",ylab="Salary (in US dollars)",  xlim=c(0,10),ylim=c(0,150000),col="grey")
  abline(h=0,lwd=2, col="grey",lty=1)
  abline(v=0,lwd=2, col="grey",lty=1)

#lets draw a trend line with the given parameters
Intercept=25000
Slope=10000

abline(Intercept, Slope, col="orange") #lets plot the trend line, and make it orange to differentiate it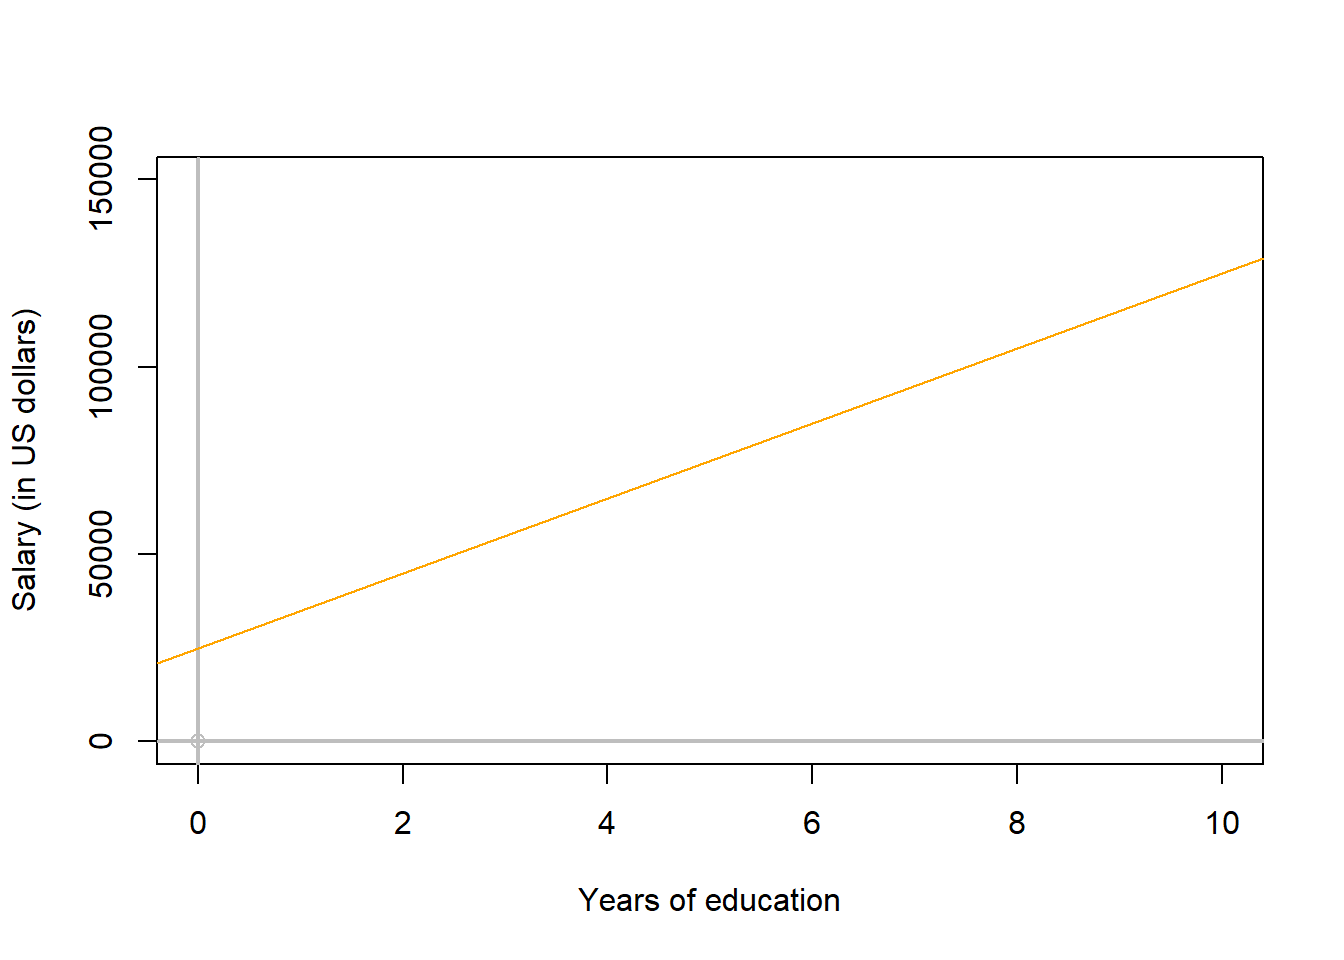
You can also ask questions, like what will be an average salary for a person that studies 4 years of higher education?..You simply replace the \(x\) variable in the equation with the number 4 and do the mathematical calculation to get the average expected salary.
\[\begin{equation} Salary = 10,000 * 4 + 25,000 \end{equation}\]
So the expected salary of a person that studies four years of higher education is $65.000.
Ok, at this moment you know the basics of a linear regression model. In a nutshell, a linear regression model is a mathematical equation that includes a slope and an intercept which allows you to draw a line, from which you can also predict any value of Y given values of X.