12 Multiple sample test
This chapter describes the mathematical approach to check for differences among more than two independent groups, or so-call ANOVA, or Analysis of Variance. Although the name of the technique refers to variances, the main goal of ANOVA is to investigate differences among means.
There are numerous ways in which you can look for differences among groups, which will determine the type of ANOVA to use. Lets check some examples, to clarify the distinctions.
Say the International Olympic Association wants to endorse an energy drink for its athletes and two different companies send samples of their products.
A first order question could be if the drinks make any difference in the endurance of the athletes. And you can compare, say the times running 100m for groups of athletes given the two types of drinks and a control given water. In this case, you want to test, if at least one of the three groups is different, and in this case, you will use what is call a one-way ANOVA. You only have one factor, which is the drink type.
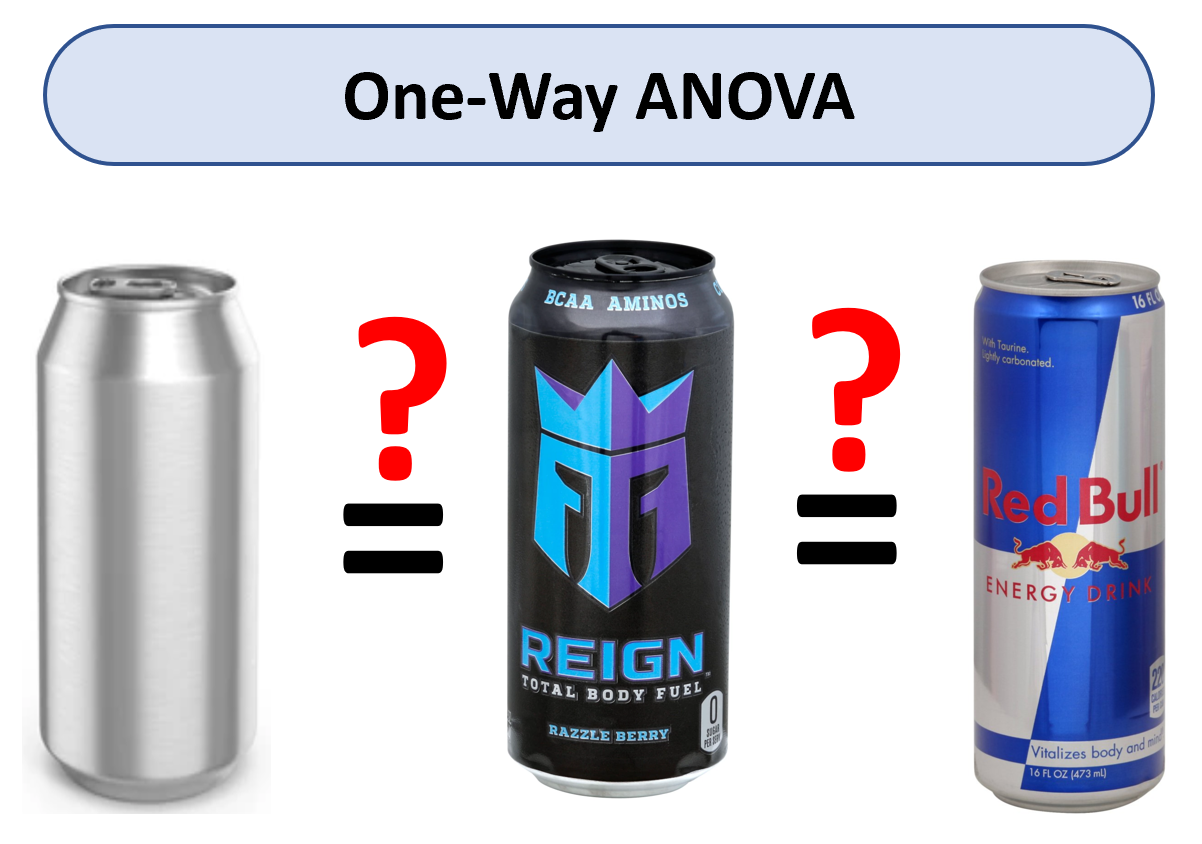
Figure 12.1: One-Way ANOVA
Say, however, that you are also interested in knowing if such an effect varies between men and females. In this case, you have two factors and you will need to know the effect of the drink and the effect of gender. For this type of cases, you will use what is called a two-way ANOVA.You have two factors (drink type and gender).
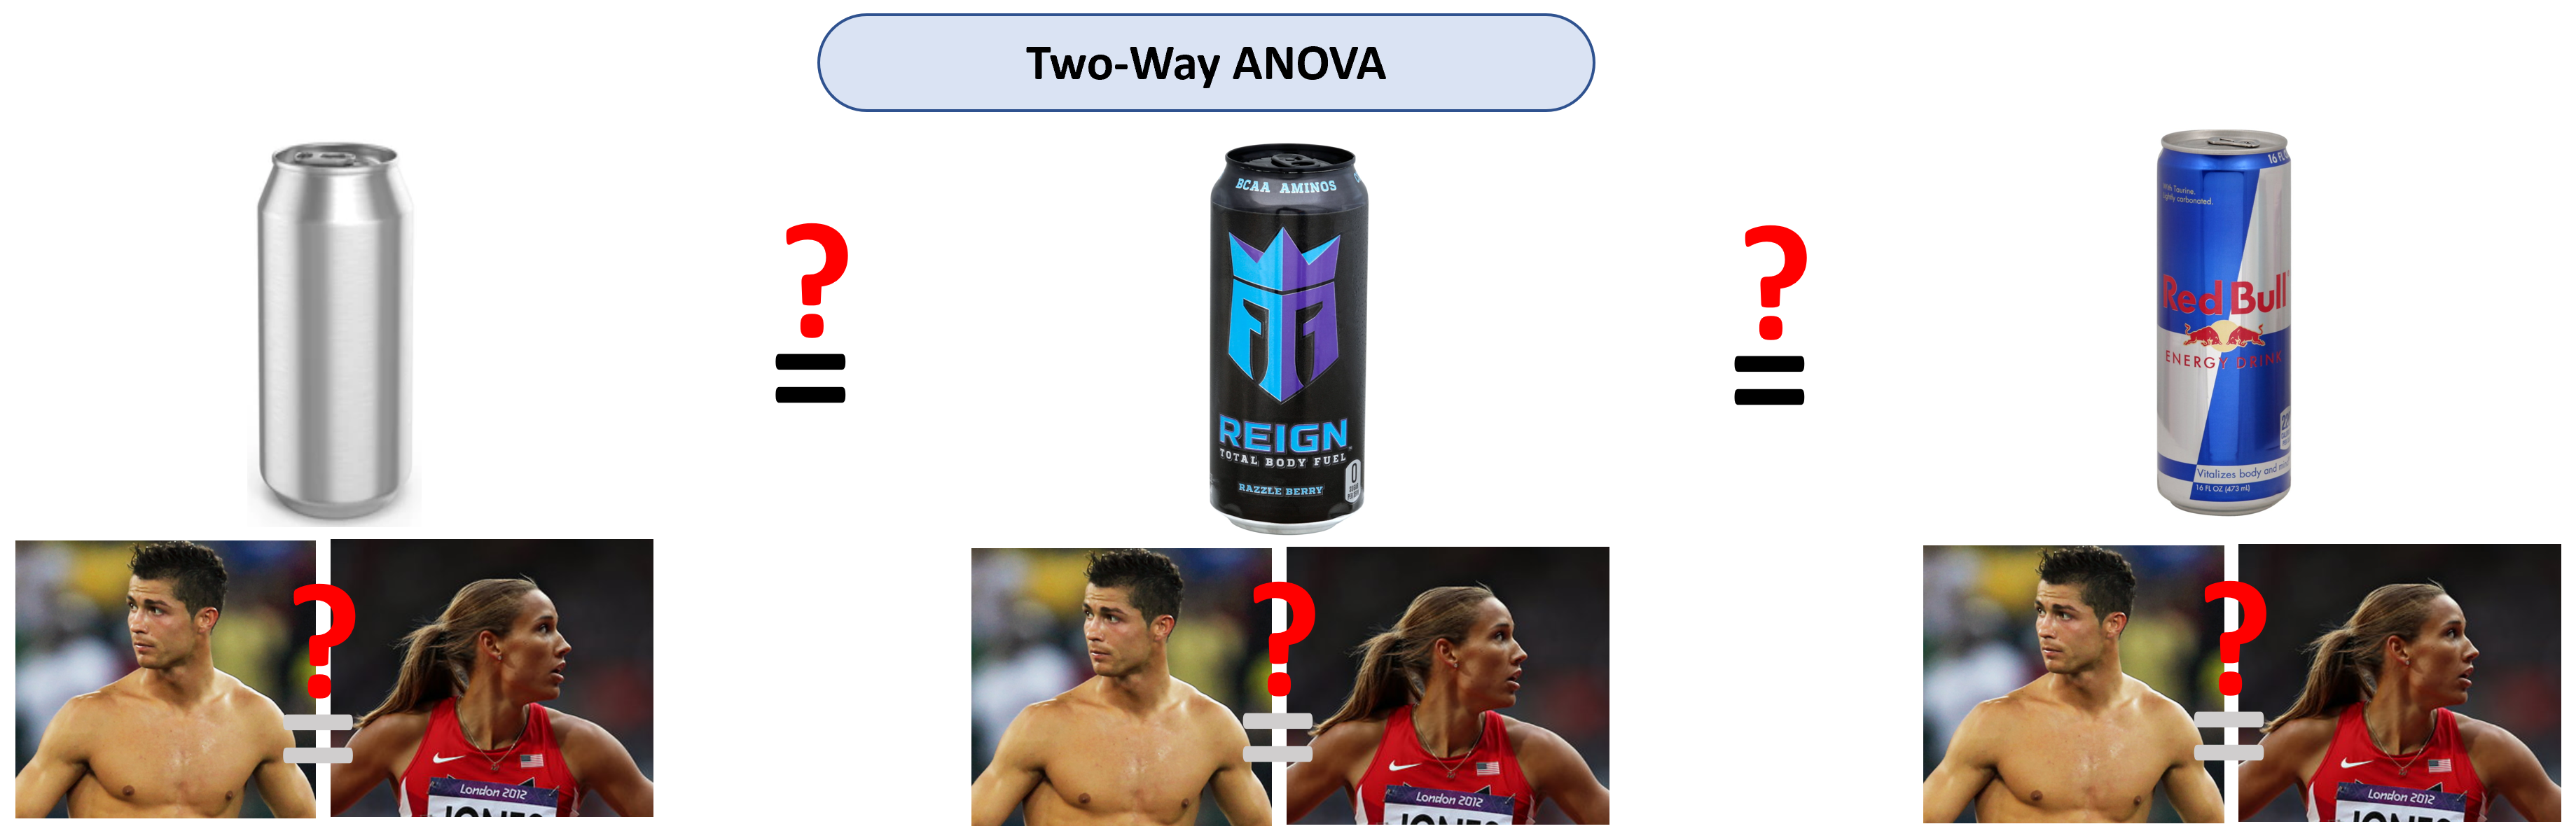
Figure 12.2: Two-Way ANOVA
If now you want to check for the effect of the drinks among different types of sports, you will now have a third factor (sport type), and then you will use a three-way ANOVA, as you have three factors: drink type, gender, and sport type.
In this course, we will study only one-way ANOVAS. You should also be aware that to run an ANOVA you need to test for different key assumptions, which we will study later in this chapter.
The data are normally distributed. As mentioned earlier, this assumption is key to all types of parametric tests. Basically, we need to know the data follows a bell shape, such that we can approximate the distribution of data.
The variances among the different groups have to be homogeneous, or so-call homogeneity of variance. As we will learn soon, ANOVA is based on the ratio of the variance between groups and the variance within groups. So if variances are non homogeneous among groups this could bias the ANOVA test.
The observations are independent.
No outliers are present.
At the end of this chapter, you are expected to:
Run an ANOVA in R, and interpret its results.
Run a post-hoc test, identify differences among specific pairs of groups.