Multiple regression
Up to now, we have used the linear regression model to predict Y in terms of only one variable, X. However, as you may have noted in the examples above, it is rare for a model with a single independent variable to predict fully the dependent variable…those residuals that are left tell you there is something else that may influence the dependent variable.
Linear regression further allows you to check for the effect of additional variables, using the same principle.
Think about it this way…you run a linear regression model with one independent variable and some residuals are left.
Take those residuals as independent variable in a second linear model, relate those residuals to another variable, and see how much the unexplained variation by the first independent variable is explained by the second independent variable.
You can keep going at it, until you could potentially find all the set of variables that explain your response variable.
The example above is an oversimplification of how multiple regression works, as there are some collinearities among independent variables that you have to handle. But for now I just want you to know that linear regression allows you to test additional variables by trying to explain the unexplained variation in Y with additional variables. The so-call multiple regression analysis.
Let’s take the data we have been using, and say, we also got data on the amount of debt of each student…this variable may indicate the level of stress of the student, a likelihood that they have a job that prevents them of working fully and well, etc…how does this second variable influences the grades of students in my class?.
Let’s check..
#lets start by bringing back the data on time studying and grades
Names=c("Peter","Laura", "John", "Chip", "Tom")
Hours_Studying=c(0.5, 1.8, 2.4, 3.8, 4.5)
Grade=c(55, 64, 75, 82,95)

#here is the data for the second independent variable for the same students
Debt=c(80, 60, 55, 15, 5) #debt of students in thousands of dollars

# we use the same lm function we used before and add debt as independent variable, like this:
MultipleRegression=lm (Grade ~ Hours_Studying + Debt)

#next we check the results
summary(MultipleRegression)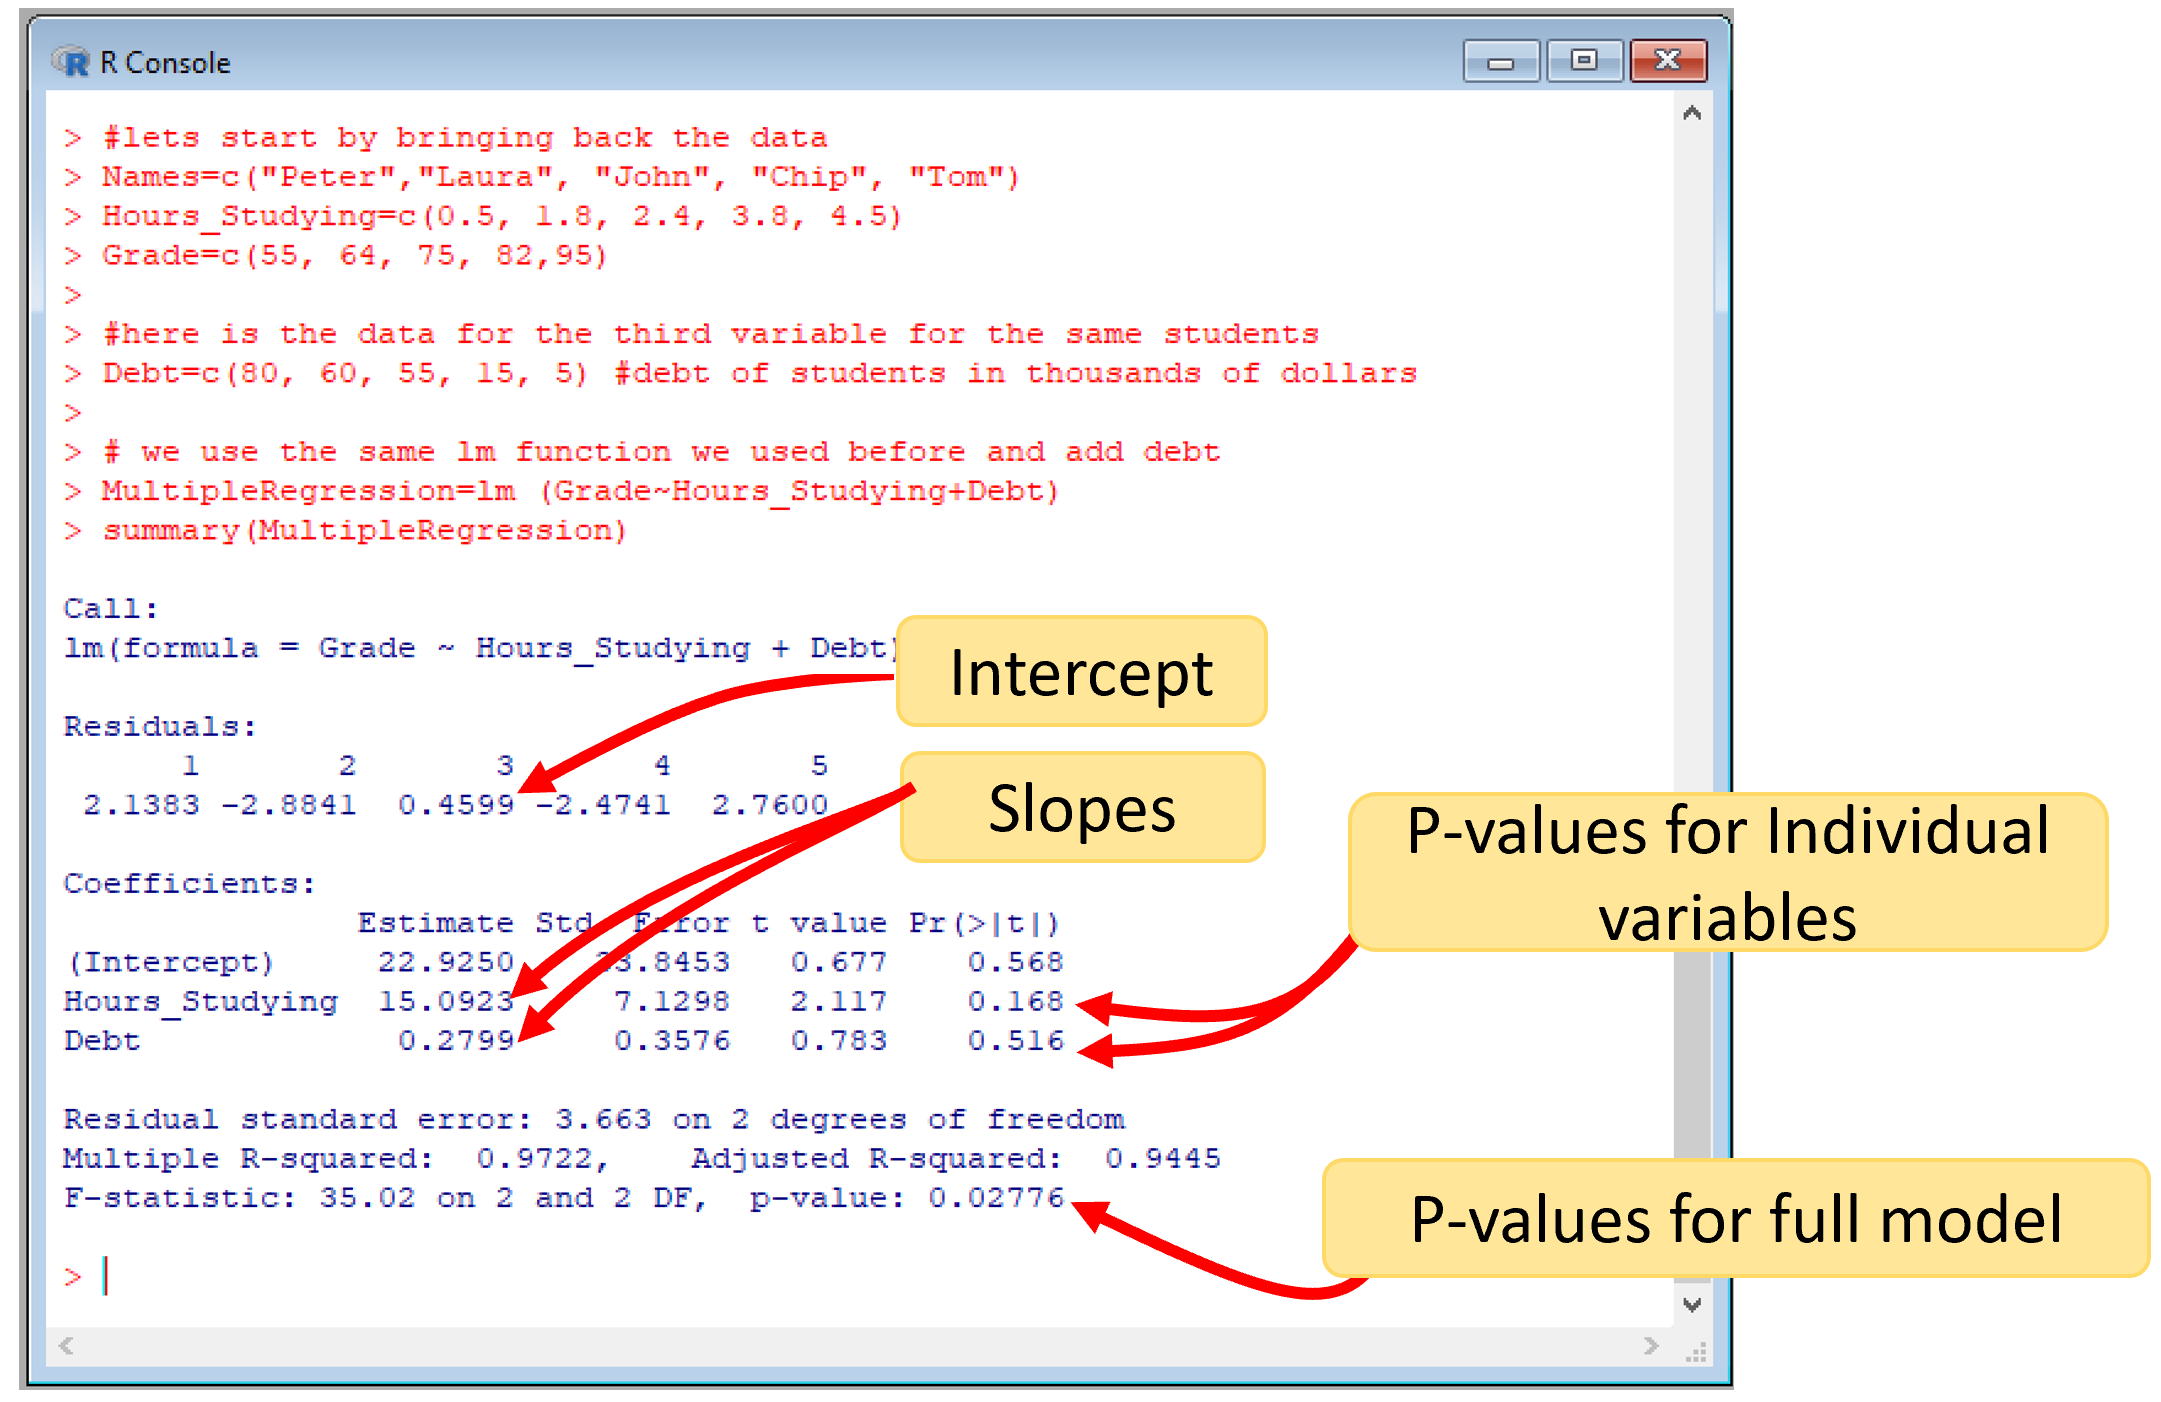
Figure 7.14: R multiple regression results
The outputs are the same as we sow before. You have a unique intercept, but now you have a slope for each variable. You also need to pay attention to a second result, which is the p-values for the individual variables, which I indicate in the image above. Plus, the p-value for the full model.
In this case, while the full model was significant, the individual variables were not.
In this specific case, this is happening because our sample size is too small, which bring me to the caution that you need to have when running multiple regression analysis: adding more variables, while it will increase the predictive power of the model, also will increase your chances that the results may happen by chance.