Saving plots
Of course, if you do a plot in R is because you want to use it somewhere else. The quick and very dirty way to get a figure from R is to use the simple PrintScreen in your keyboard, which will create a figure of whatever you have in your screen at the moment.
Figure 4.6: Pixelation effect of figure format
After clicking on Print screen, then open any software, like Paint, Word, PowerPoint, etc., then right click on a new document and click Paste to display the figure.
Of course, R offers many formats to save plots. Here we will save a figure as a PDF using the function “pdf”.
Basically, the function pdf requires you to write the name you want for your file (e.g. “RPlot.pdf”), how big you want the plot, the size of the letters, and few other options. Type ?pdf to see additional settings.
The way to save any figure in R is like this: Firsts, you write the line of code indicating the type of file you want to save as. That creates a clean sheet, where you can place your plot or plots. Once done with your figure or figures, you need a line of code called dev.off(); that closes the sheet and save the file. Lets try,
pdf("RPlot.pdf", width = 3, height = 3,pointsize=8,paper="letter")
plot(bin,colramp=my_colors)  #hexbin plot
dev.off()
If you now check your working folder, there should be a file called RPlot.pdf, which has the figure you just created. Of course, you can edit the figure as you like, as we showed in the Scatterplot section.
The benefit of l saving files as PDF is that the resolution is never affected. You can zoom in into a PDF file and the resolution is always the same. In turn, other types of figures like jpeg, gif, png, etc. you need to define the resolution in advance, and if you zoom in into those type of figure formats you will notice the pixelation.
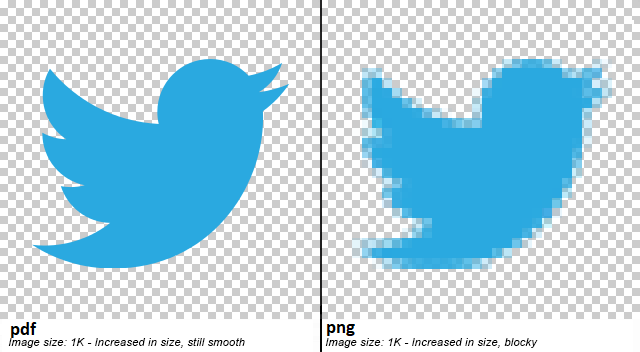
Figure 4.7: Pixelation effect of figure format