Significance
If you were to take any two random variables and correlate them together, you will still get a correlation value.
You may think that if the two variables are random, then the correlation will be close to zero…well, you are wrong.
It turns out that even by random chance alone, two variables may still be correlated. The chances of getting a higher correlation increase the lower the sample size.
Just think about it, if you were to correlate any two data points, almost certainly your correlation will be 1 or -1.
To address this potential caveat, we need to assess the “Significance” of the correlation. Basically, can the correlation you found emerge by chance alone?
That word “significance or significant” is tricky because it implies a level or threshold of error you are willing to take. That threshold is called critical value, commonly identified with the letter alpha, \(\alpha\). Again it is the margin of error you are willing to accept as error.
In biology, we normally give ourselves a 5% chance of being wrong (p<0.05). But at times, it is preferable to be more certain and we take only a 1% chance (p<0.01). At times rather, you just provide the exact probability of the correlation being random, in which case we provide the exact p-value.
correlation tables
For the case of the correlation, the significance of the correlation can be assessed quickly with a probability table, as the one shown below:
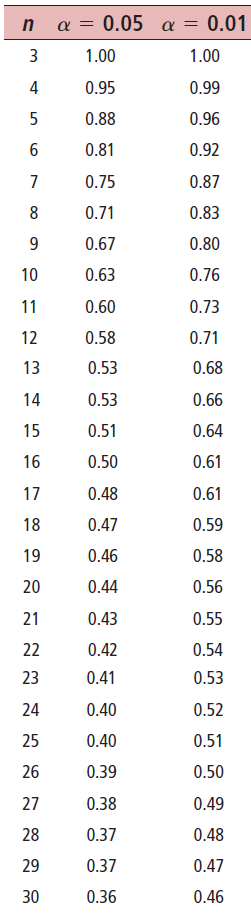
Figure 6.10: Significance of correlations
Lets use the example we have been working on about the relationship between the time students study and their grades. In that case, \(r\)=0.98 and the sample size \(n\) was 5 students.
Is that coefficient of correlation significant?. Can I obtain a similarly high correlation, ifor any similar set of random variables?.
To find out, you first select your critical value, \(\alpha\), lets choose 0.05. In this case, the second column in the table above will be the one we are interested on.
Next, you scroll-down column one until the sample size in the table matches ours (that is 5).
At that row, if you look over the value in the second column, that is the coefficient of correlation of any two random variables with five points. In our case, that value is 0.88.
Our correlation coefficients was larger, \(r\)=0.98, meaning that it is unlikely our correlation could occur by chance alone.
There you have it: the more time you study the better grades you get, now demonstrated mathematically. Take a couple tokens, gh, so you do not forget that conclusion!
Correlation p-values
At times, you want to be more specific about the likely error that the correlation you found can be caused by chance alone. In this case, we need to report an exact p-value. Later on we will be studying p-values in more detail.
In R, the exact p-value of a correlation is calculated with the function cor.test.
##
##  Pearson's product-moment correlation
##
## data:  X and Y
## t = 8.9289, df = 3, p-value = 0.002963
## alternative hypothesis: true correlation is not equal to 0
## 95 percent confidence interval:
##  0.7427169 0.9988455
## sample estimates:
##       cor
## 0.9817004
There are several things to the output of that R-function, cor.test, but for now, you just need to focus on the p-value number, which in our case, for the correlation between time studying and grades, is p-value=0.002963.
Basically, given our sample size, there is a 0.3%, less than 1% chance, that our correlation can emerge by chance alone. In conclusion, if you want a good grade in my class you really need to take good time to study. Mathematics tells you that there is no way around it; we are nearly 99.9% that is a legit correlation!.