Pivot table
Pivottables are a functionality originally developed in Excel, which allows you to summarize data by attributes. Lets do an example to see how this work.
##       country continent year gdpPercap
## 1699 Zimbabwe    Africa 1982  788.8550
## 1700 Zimbabwe    Africa 1987  706.1573
## 1701 Zimbabwe    Africa 1992  693.4208
## 1702 Zimbabwe    Africa 1997  792.4500
## 1703 Zimbabwe    Africa 2002  672.0386
## 1704 Zimbabwe    Africa 2007  469.7093
If you look at the GDP database above, you will see that the data also includes the years of the GDPs. What if I want to summarize the data by country? Say for each country, I just want the average of all GDPs of the different years?. For that we use the function summarize from the dplr package. Like this:
Ok, now let that code talk to you. Code is like reading a book; you read from the first word forward to start making a visual representation of that the sentence is saying.
Coding is not different. Lets take the code above and read it from left to right, like in the image below. In the image below you can see what each part of the code is saying.
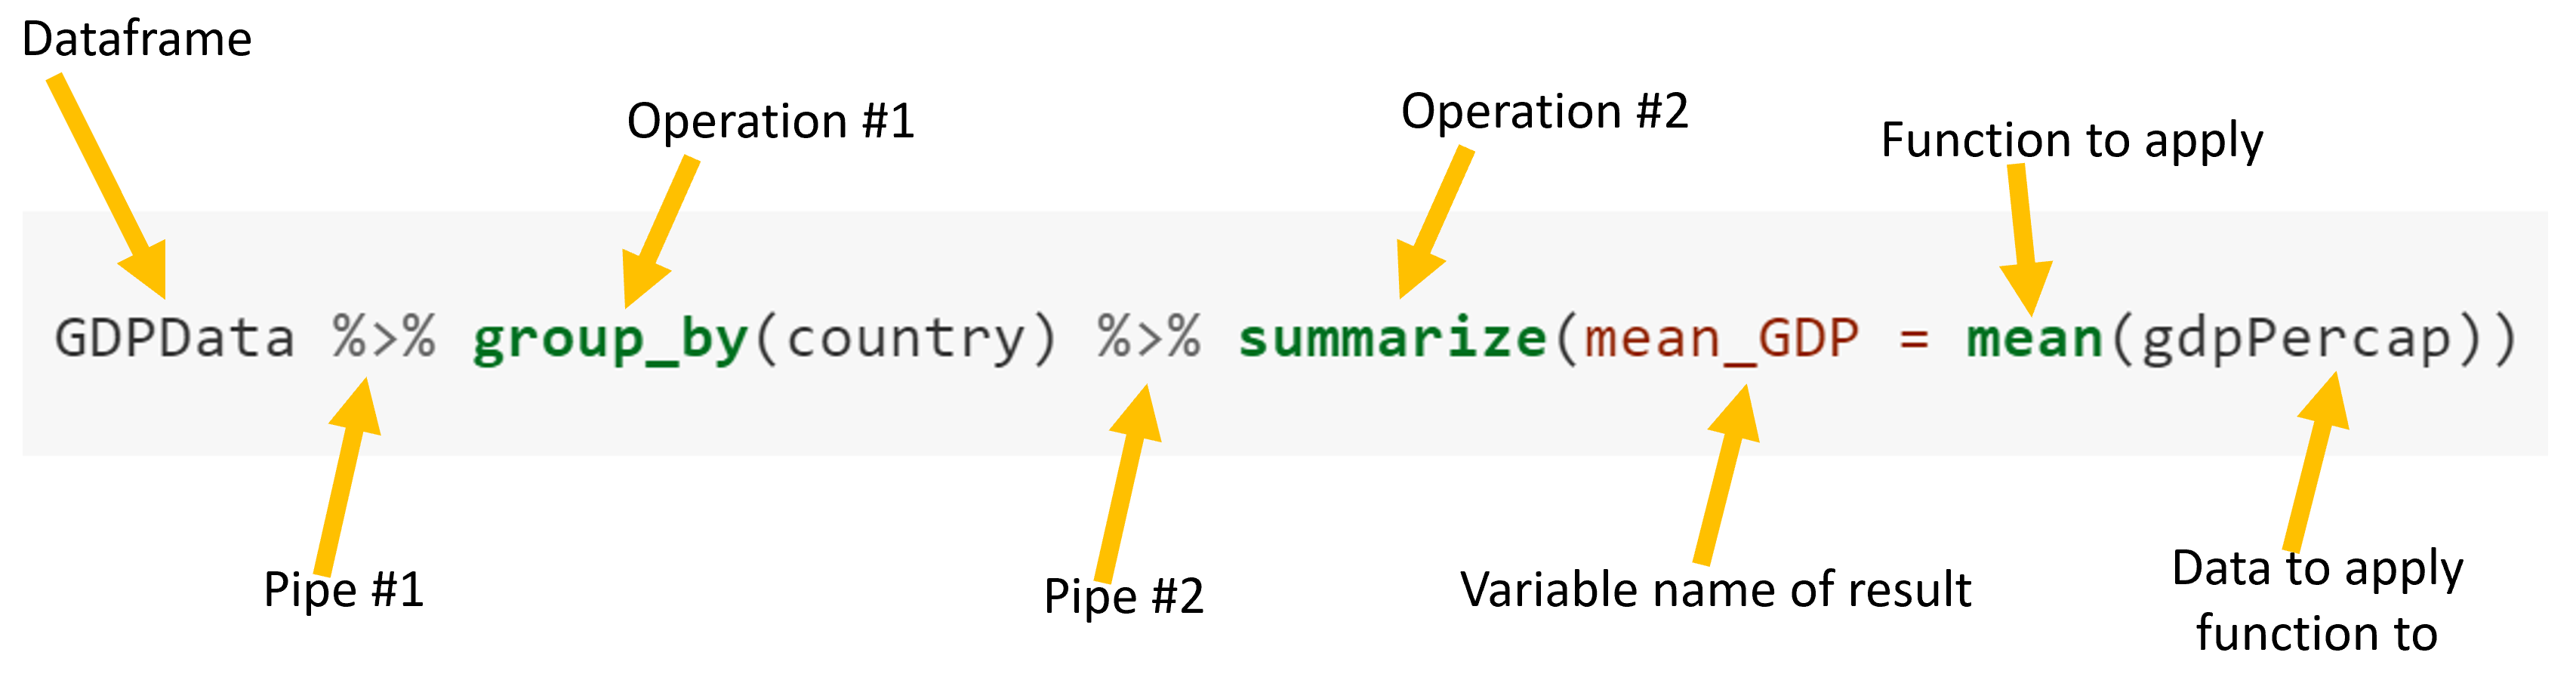
Figure 3.8: Filter function
It is a good practice for you to read the code. Lets tray to translate the code above (look at the image above as we do the translation). Here I go….first I take the dataframe called GDPData, then I group that dataframe by country, then I summarize the data on GDP by the mean values, oh, and I want the resulting mean to be called mean_GDP. Easy right!.