Data distributions
As mentioned several times in this class, the first thing to always do when analyzing data is to create a visual representation. You need to see what are the general tendencies in your data, and for that we commonly start with the frequency distribution.
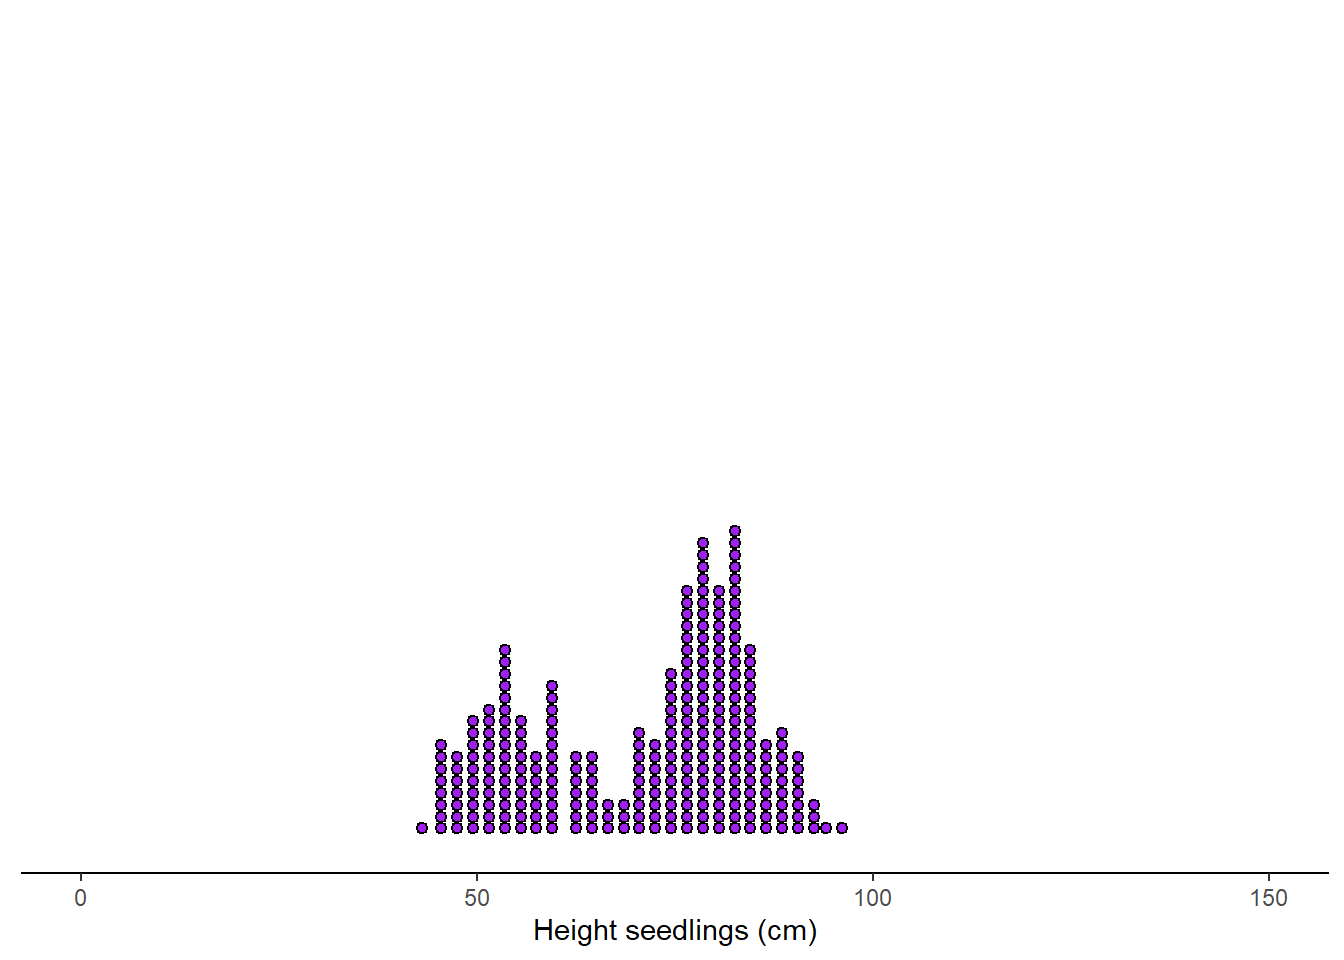
Lets image that the plot below is the number of seedlings (points) at each height in my nursery. Interesting, ahh?. That type of distribution is called bimodal (there are two peaks in the data). Clearly, there is something going on in my nursery, some seedlings are doing particularly better than others.

p
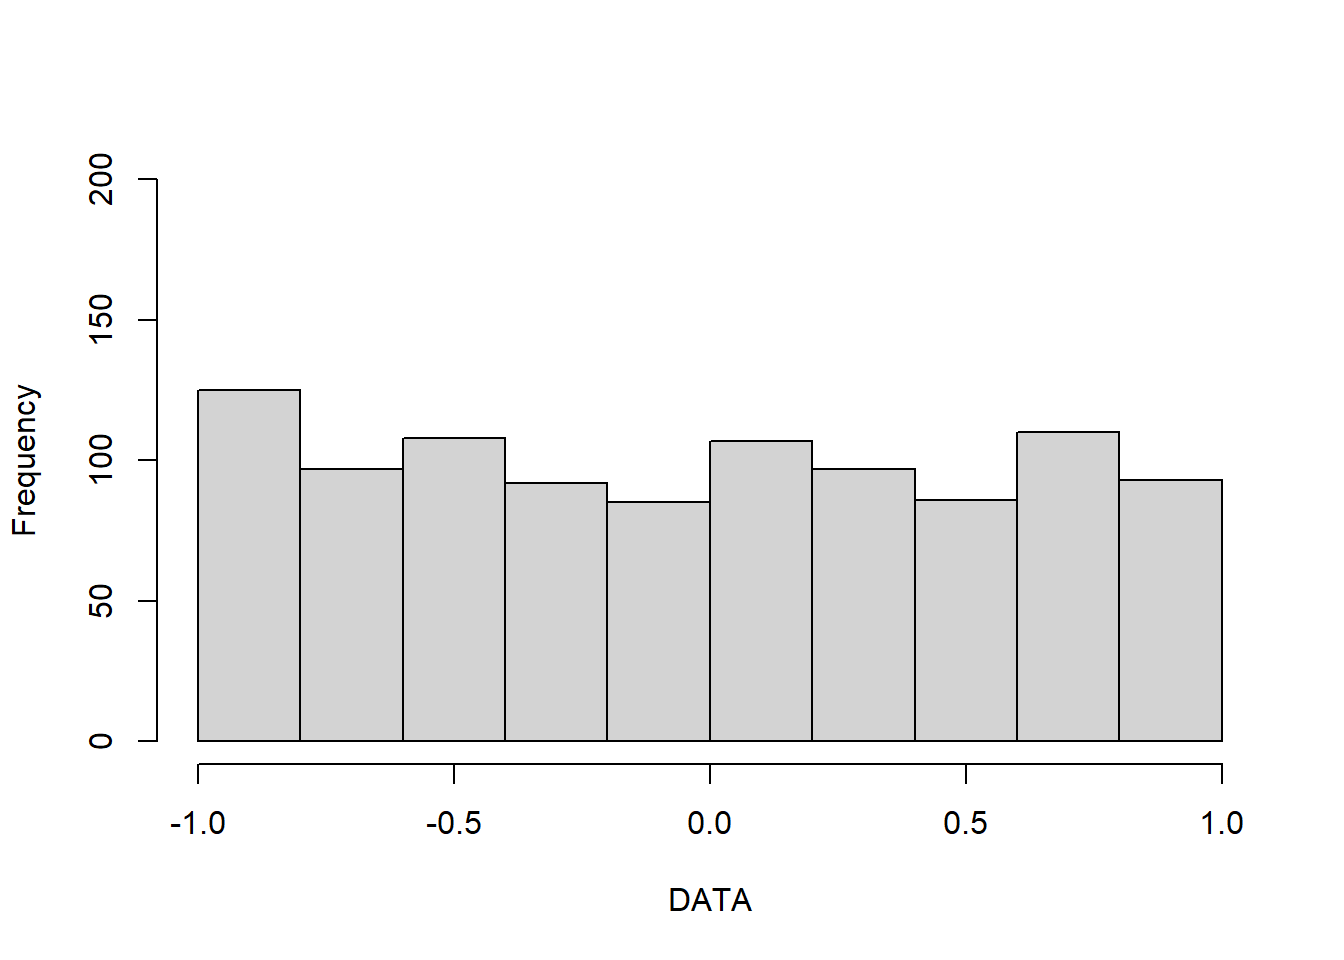
The distribution below is called a uniform distribution, any number is just as likely.
o
The distribution below is called a left distribution. I know, it is weird how the data tend towards the right but it is called a left distribution. It is also called negative or asymmetrical distribution. Because it has only one peak, it can also be call unimodal distribution.
In the figure below, you can explore different distributions,