Interpreting r
The correlation coefficient, \(r\), is unitless…by dividing by the standard deviations the products of the differences in x and y, the result loose its units. This means the value can be compared among studies for any set of x and y variables but can also be interpreted between a set of standard values (i.e., -1 to 1).
In short, the correlation coefficient, \(r\), can range from -1 (perfectly negative correlation) to 1 (perfectly positive correlation). Like in the images below.
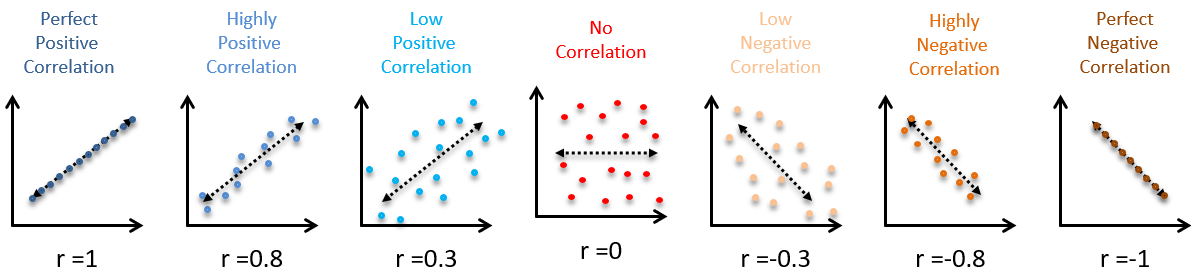
Figure 6.7: Examples of correlation coefficients