7 Regression
While the goal of correlation is to give you a metric of the strength of the relationship between two variables; the goal of regression is to give you a numerical representation of the tendency in your data. That numerical representation is called a model that describes a line that best represent the tendency in your two variables. At times, that line can also be called a regression line or a trend line.
Here we will be working on linear regression models…this means to find an straight line to best represent the relationship between two variables.
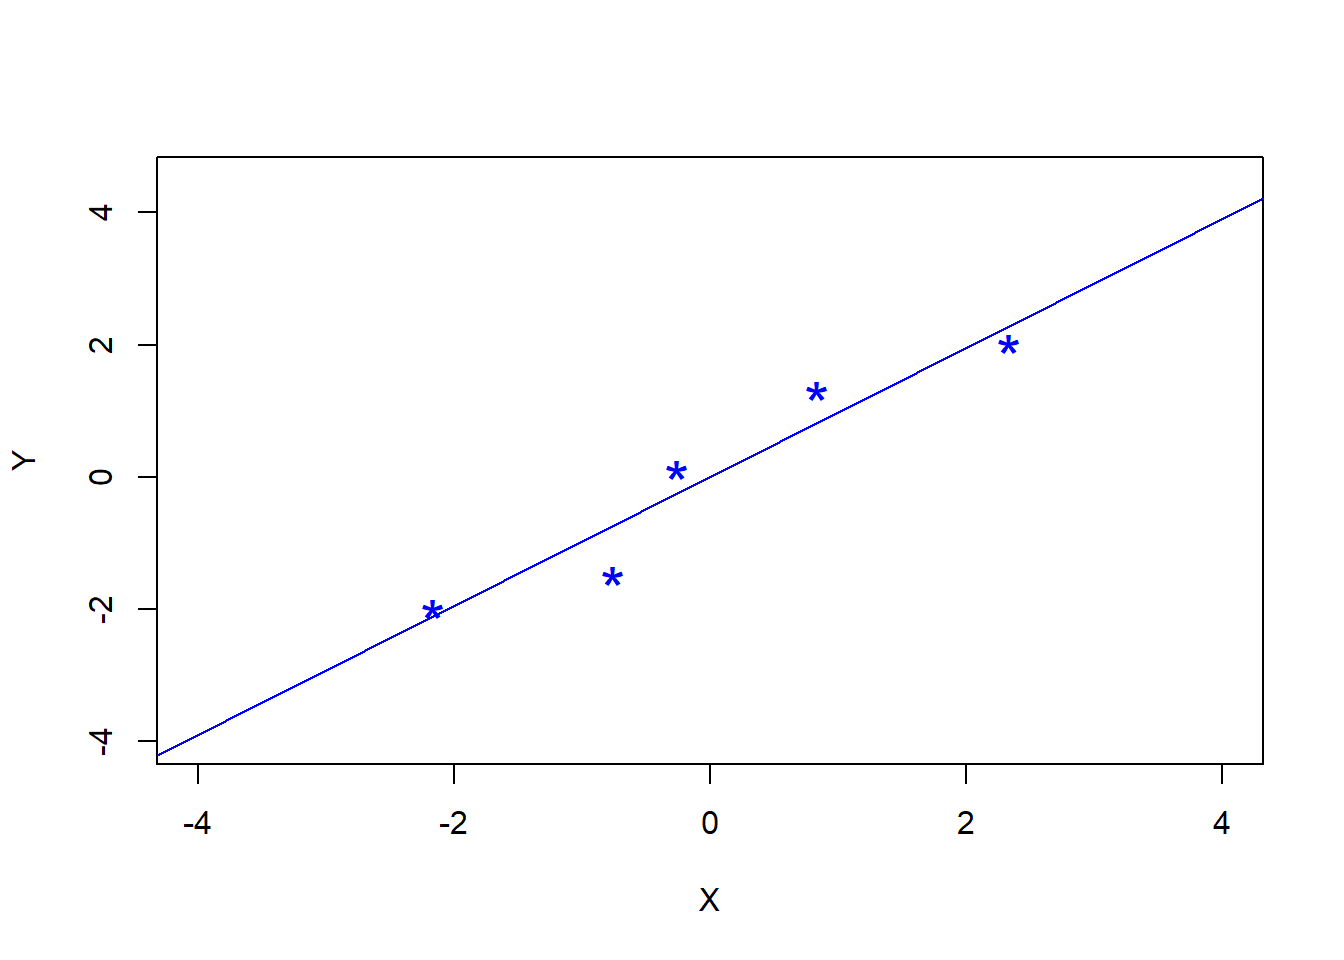
For instance, the blue line below appears to represent well the tendency that exist between variables Y and X. The goal of this chapter is to use a mathematical procedure (linear regression) that allows you to identify that line.
As indicated in the prior chapter, all relationships do not have to be linear, there are also those so-call non-linear relationships. For now, we will cover only linear relationships, or straight lines that best summarize the relationship between two variables.
There are a few cool benefits to having a single line describing the data:
It allows you to mathematically define how two variables are related. Like if I increase X by 2 then Y increases by how much?.
It will allow you to make predictions over areas in which you have no data. Like if X is 52.3 then Y is?
You do not need to carry/display the data every time you want to work with the database.
To define that best-fitting line, we will use what is called the least squares method; sounds scary, but it is actually very simple.
\[\\[.0005in]\]
Expectation for this chapter
At the end of this chapter, it is expected that you:
Can estimate a linear regression model that defines the linear relationship between two variables using the least-squares criterion.
Be able to interpret the results from a linear model.
Use the equation of the regression model to predict Y-values (interpolation and extrapolation).
Calculate the coefficient of determination and understand what it tells you about the relationship between two variables.
Alright, let’s get to it.