9 Standard hypothesis tests
In the prior chapter, we learned that the basic principle of hypothesis testing was to find out if a given value (from a sample) was on the extremes of a population. The threshold for what we mean by extreme is determined by the \(\alpha\) value. We can test a hypothesis by brutal force running a simulation, but we can also run a set of available tests that will tell you the position of your sample in relation to the population.
There are a diversity of statistical tests available for testing hypotheses, but here we will deal only with those tests intended to test if one thing, two things or more than two things are different.
By the way, the suitability of available tests depends on whether your data are normally distributed or not (please recall from chapter 3 that normally distributed data looks like a bell-shape curve).
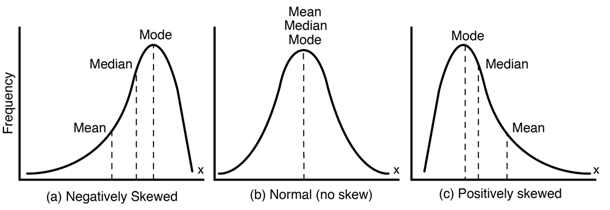
Figure 9.1: Data distribution
Tests for normally distributed data are call parametric tests. In cases, where your data are not normal (e.g., it is biased, or homogeneous) requires a different set of tests called non-parametric tests. We will not cover non-parametric here but you need to be aware of this distinction.
Expectation for this chapter
At the end of this chapter, it is expected that you can identify the case you want to test (i.e., one, two or more sample tests), and select the proper statistical method to test for significant differences for each case.