Estimating the least-squares line
The ultimate goal of a linear regression model is to identify the parameters for the intercept, \(b\), and the slope, \(m\), of the line that minimizes the sum of square errors also called least-square errors.
Refreshing the Slope
Before we get into the mathematical equation to describe the slope of the linear regression model, lets review your 4th grade geometry about how to calculate the slope between two points.
If you recall Ms. Smith, your Match teacher in 4th grade, she told you that the slope between two points can be calculated as:
\[\begin{equation} Slope = m = \frac{\Delta y}{\Delta x}= \frac{y_{2}-y_{1}}{x_{2}-x_{1}} \end{equation}\]
Basically, the change in Y divided by the change in X. Put another way, if I change X by 1 unit, how much will Y change?
Lets check the math, using a line for which we know the slope, using the R-function abline, as we did earlier.
Slope= 2  #lets set a line with a slope of 2
Intercept=1 # We do not need the intercept but lets use a value of 1 as an example

plot(0,0,xlab="X",ylab="Y", col="blue",pch=".", cex=2, xlim=c(-0,4),ylim=c(0,8), yaxs="i", xaxs="i") #lets create an empty plot

#Next we draw the line with the known slope:
abline(Intercept, Slope ,col="blue",lwd=1)

#Now place two points along that line...say a point at the coordinates (1,3) and another point at the coordinates (3,8).
#If you recall, the coordinates of a point are x and y given between parenthesis.

# draw Point 1 in the plot and put a label to it.
points(1,3,pch=21, col="black",bg="yellow",cex=2,lwd=.1) #First point
text(1,3, labels="(1,3)",pos=2) #lets create a label

# do the same for Point 2
points(3,7,pch=21, col="black",bg="yellow",cex=2,lwd=.1) #second point
text(3,7, labels="(3,7)",pos=2) #lets create a label

#lets draw a segment for the change X: is x0=1, and x1=3, then the difference is 2.
segments(x0=1,y0=3,x=3,y=3, col="red", lty=2,cex=2) #lets draw the segment for the difference in x between the two points, and make it red
text(2,3, labels="2",col="red",pos=1) #lets create a label for that segment

#lets draw the difference in Y, which basically y0=3, and y=7, so the difference, delta, is 4.
segments(x0=3,y0=3,x=3,y=7, col="blue", lty=2,cex=2) #lets draw the segment for the difference in y between the two points
text(3,5, labels="4",col="blue",pos=4) #lets create a label 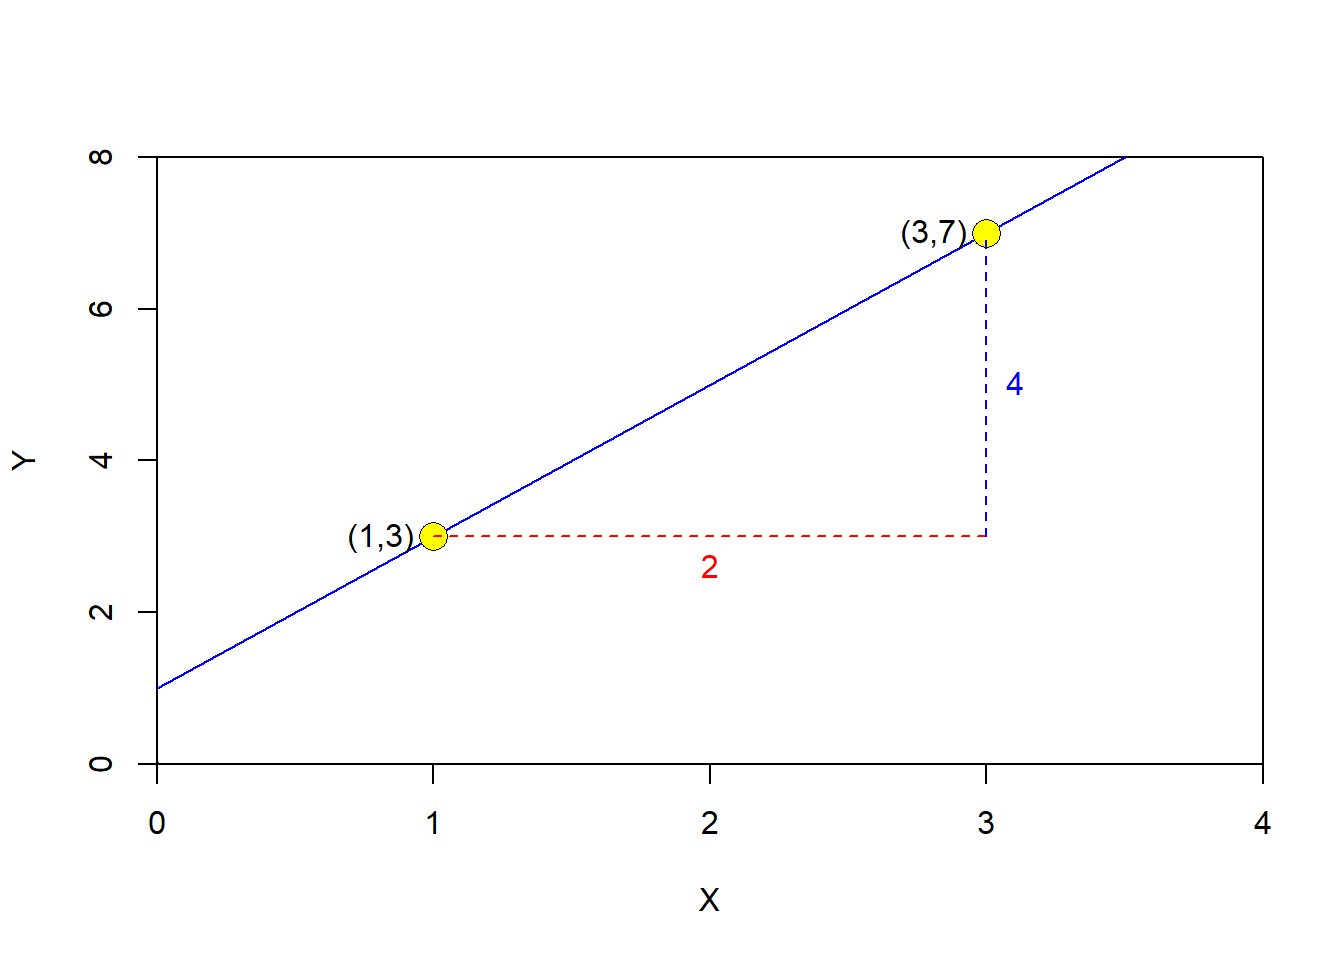
Continuing with the example above, the change in Y, also called \(\Delta y\), was 4. The change in X, also called \(\Delta x\), was 2. So, the slope can be calculated as:
\[\begin{equation} m = \frac{\Delta y}{\Delta x}= \frac{4}{2}=2 \end{equation}\]
That is exactly, the slope we set in abline, which serve the purpose to illustrate that the slope of a line is simply the change in Y divided by the change in X.
With that in mind lets now calculate the slope of the regression line