Price to Earning (P/E)
You can extent the use of the EPS to adjust by the price of the shares.
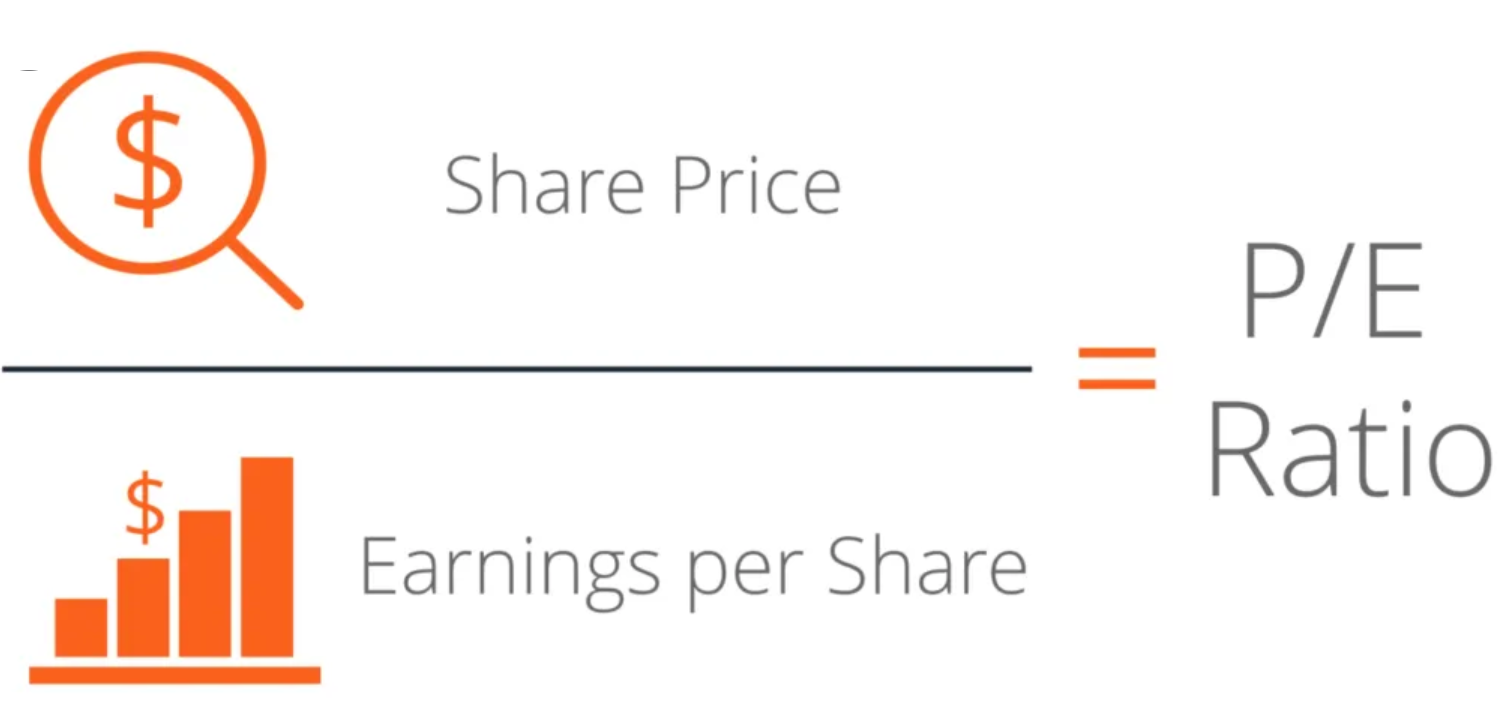
Figure 6.3: P/E ratio
This metric is interpreted a couple ways:
how much money you have to pay in stocks with this company to get $1; or
how many years you have to wait to get your money back with this company.
A high P/E could mean that a stock’s price is high relative to earnings and possibly overvalued. A low P/E can indicate either that a company may currently be undervalued or that the company is doing exceptionally well relative to its past trends.
Lets consider two companies:
AI’s Ice cream (A):
Stock Price = $18
Diluted EPS = $2
P/E = 9x ($18 ÷ $2)
Bob’s frozen snacks (B):
Stock Price = $18
Diluted EPS = $6
P/E = 3x ($18 ÷ $6)
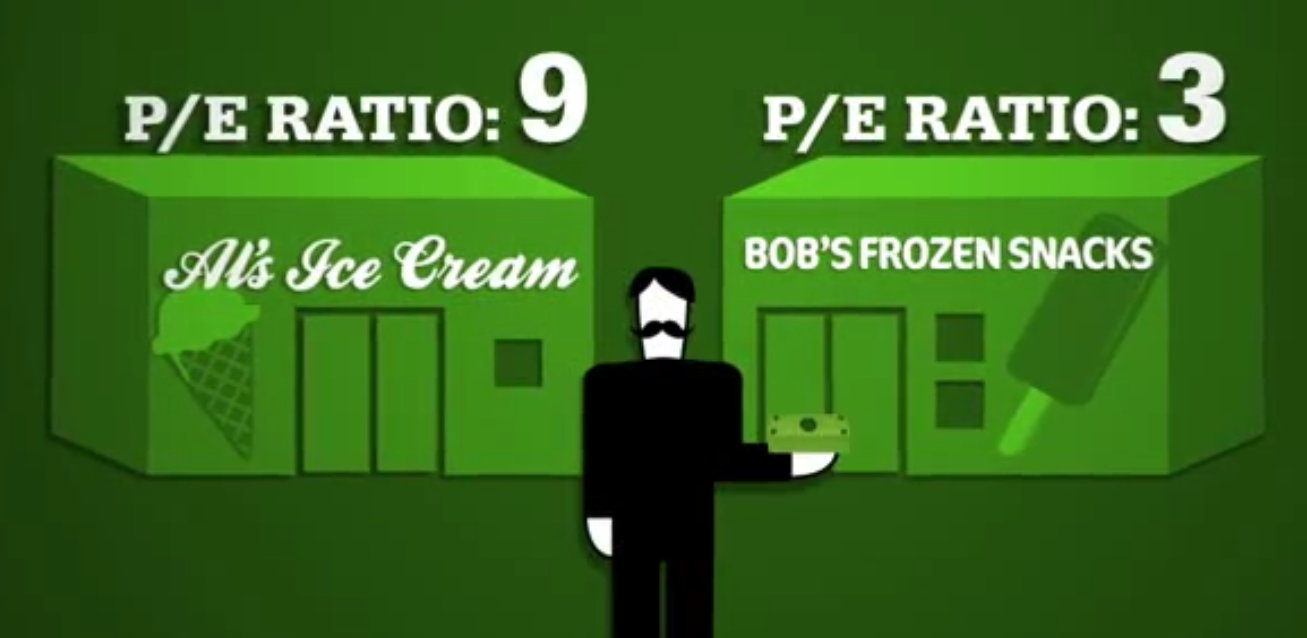
Figure 6.4: P/E ratio
In this example, in company A you pay $9 for $1 of earnings, while in company B you pay $3 for $1 of earnings. Basically, you can get three times as much in returns by investing in company B.
Forward Price-To-Earnings is a variant of the P/E index, which uses best guess estimations of future earnings of the company. You could also see the trailing P/E or TTM, which is the P/E ratio in the last 12 months.