111 Mass Index (massi)
Mass index examines the range between high and low stock prices over a period of time. The specific equation is:
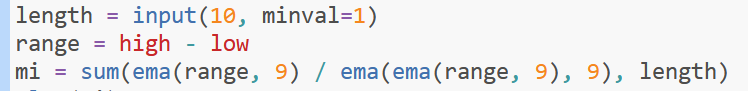
Figure 12.16: Mass Index equation
You can think of Mass Index as the speed at which price differences are widening; Mass index suggests that the widening and then narrowing of trading ranges identifies potential reversals.
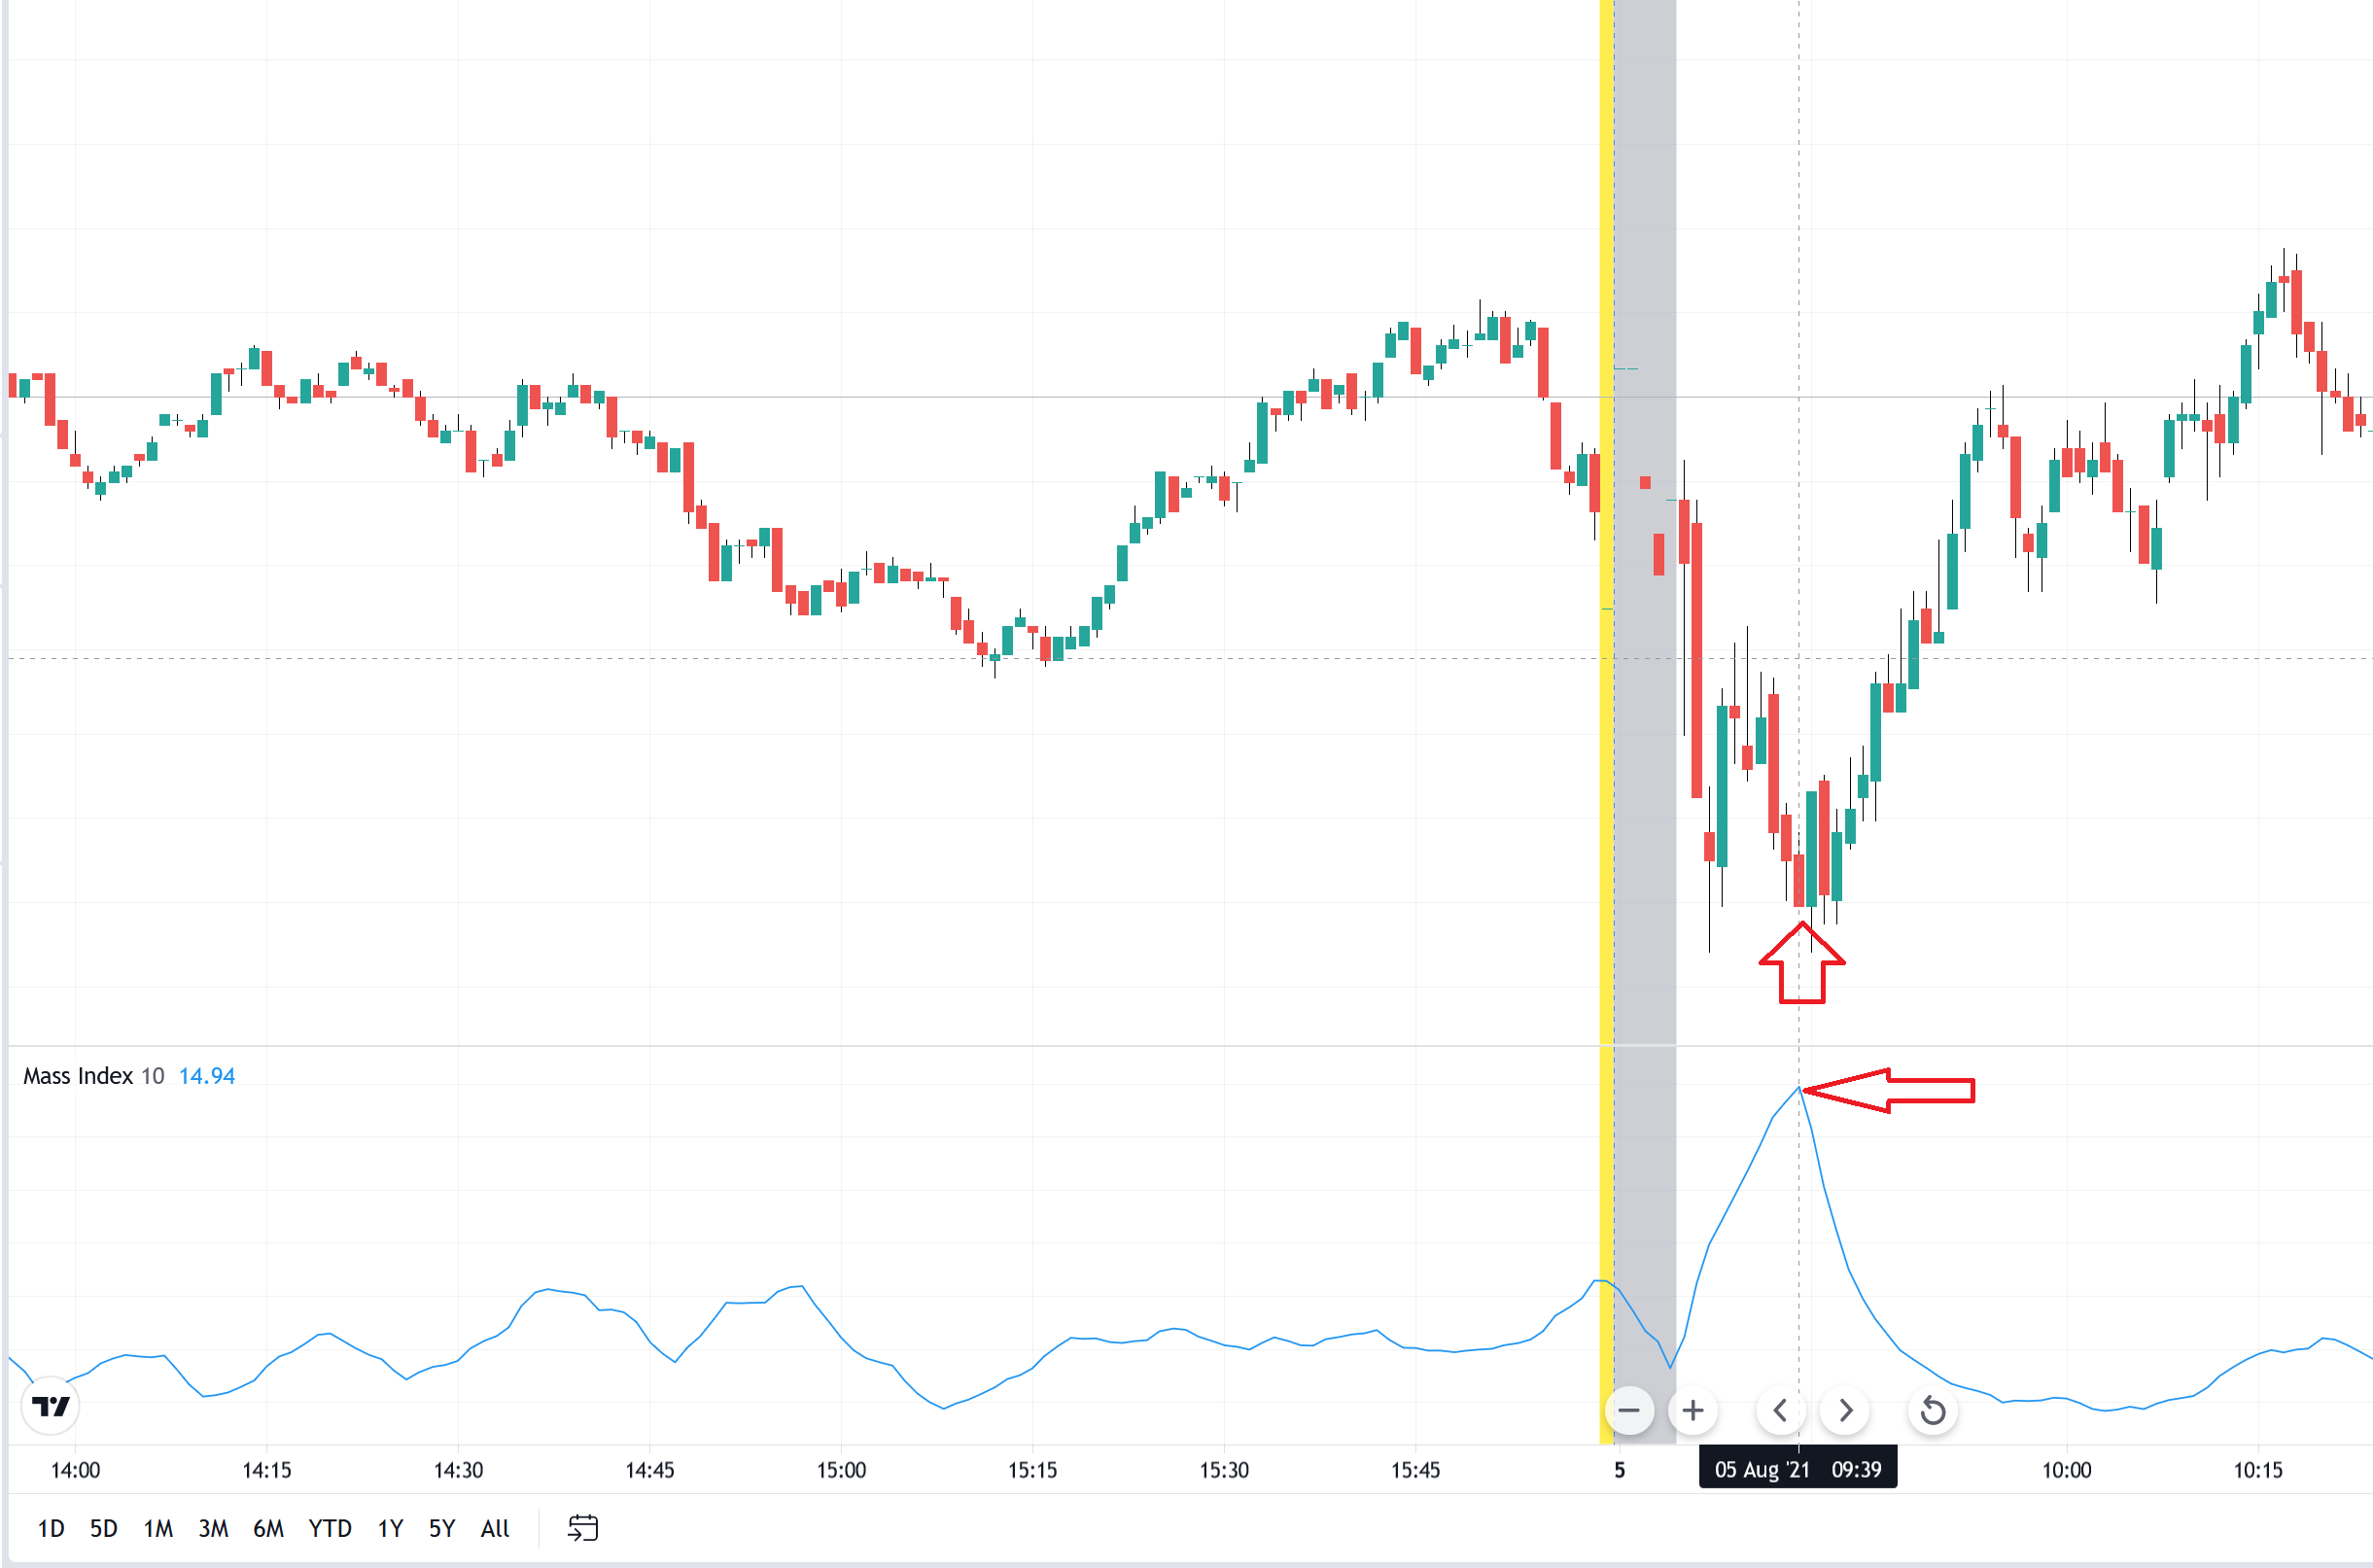
Figure 12.17: Mass Index