106 Donchian Channel
It is the max and min values of prices added to an EMA. It does indicates the bands of price volatility.
When price, trends close to upper band it supper bull.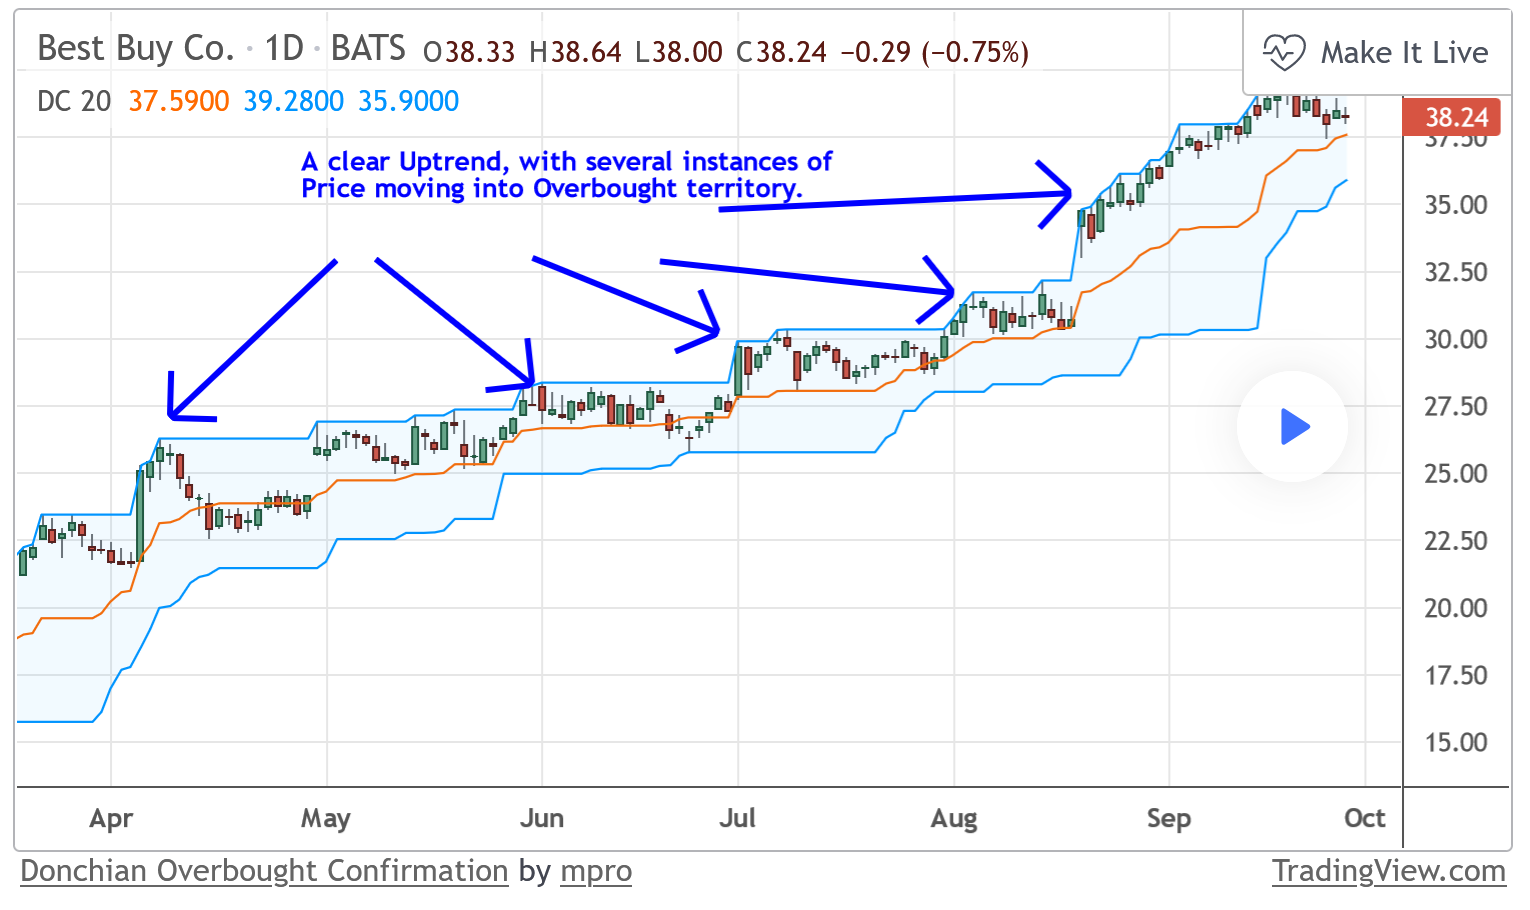
Figure 12.9: Donchian Channel
Before price trend, it could move temporarily in the opposite direction. Like a small resistance by the losing team.
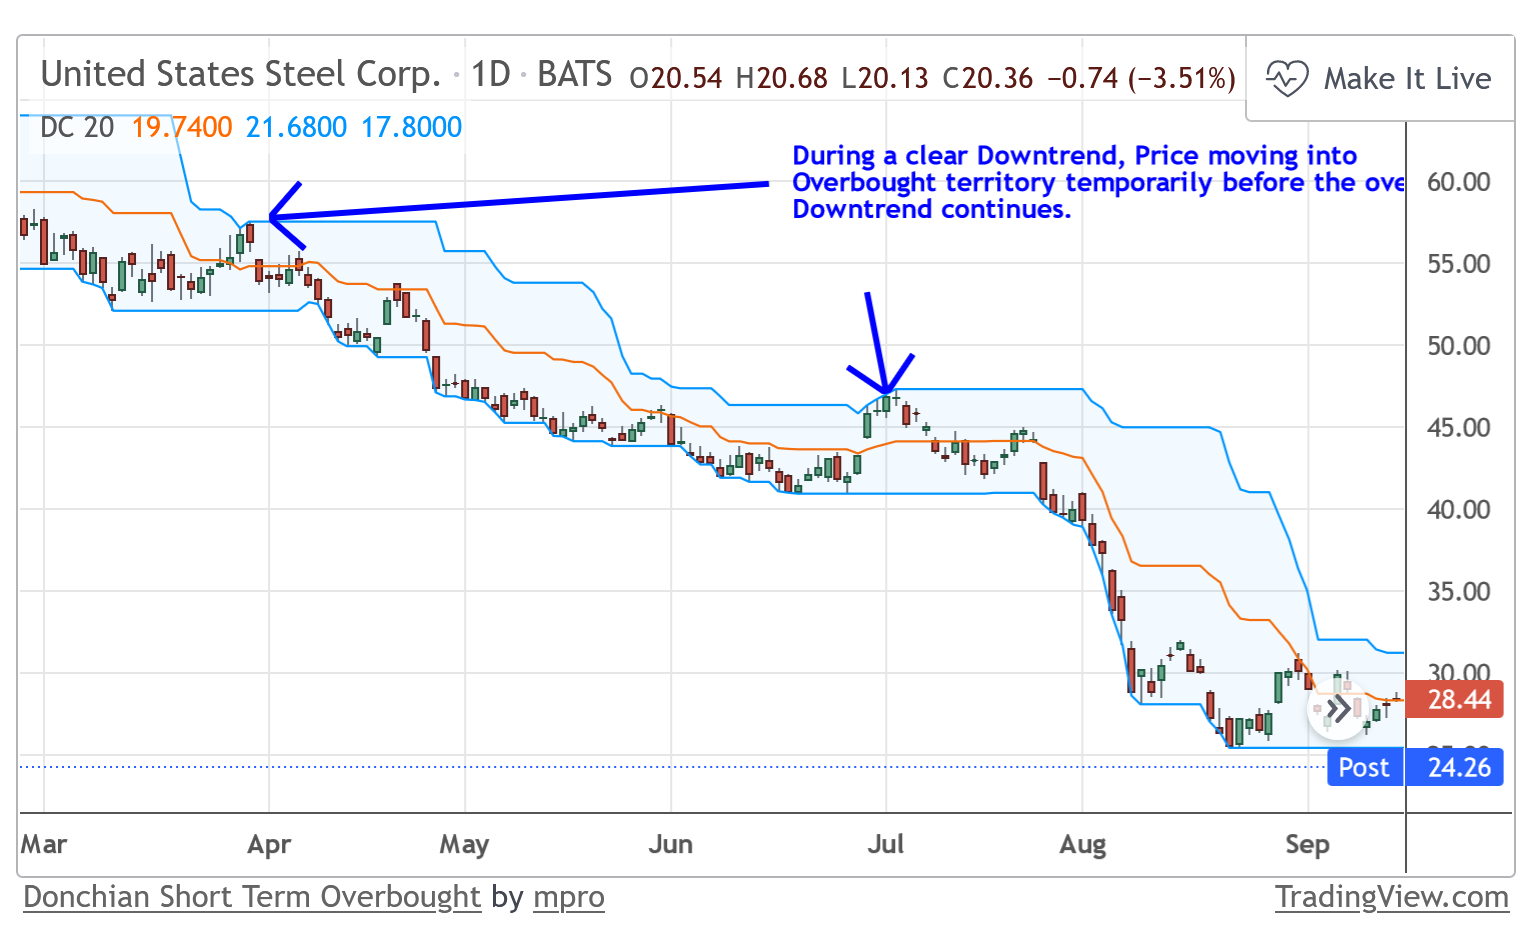
Figure 12.10: Donchian Channel