132 On balance volume (OBV)
To calculate this index,
if the price at a given period when up, then the period’s volume is added to the prior volume.
if the price at a given period when down, then the period’s volume is subtracted to the prior volume.
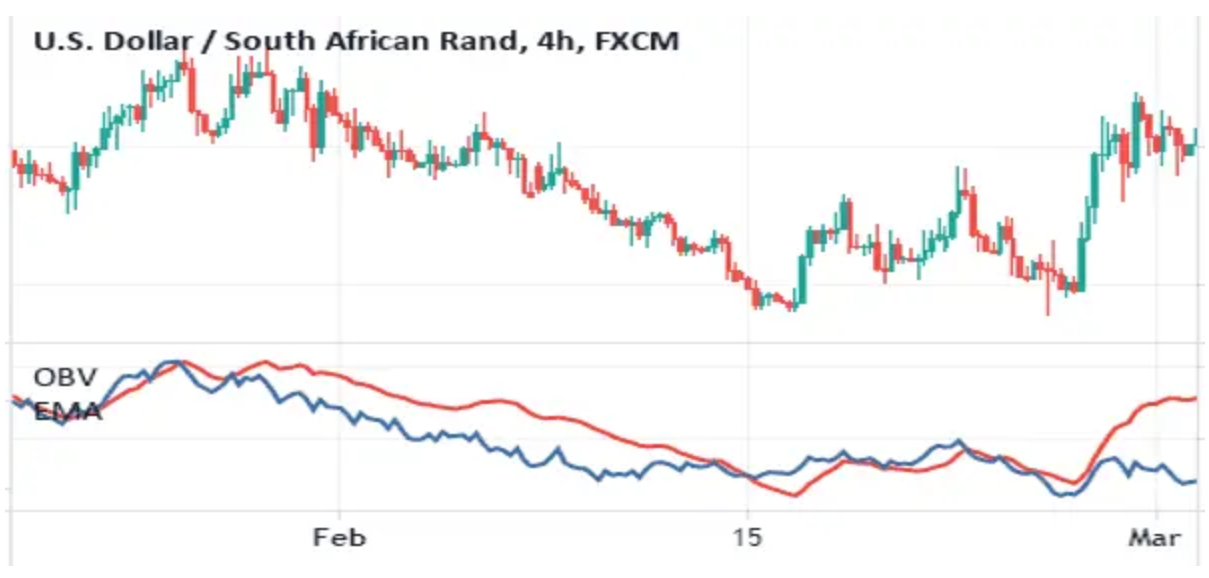
OBV measures buying and selling pressure as a cumulative indicator, adding volume on up periods and subtracting it on down periods.
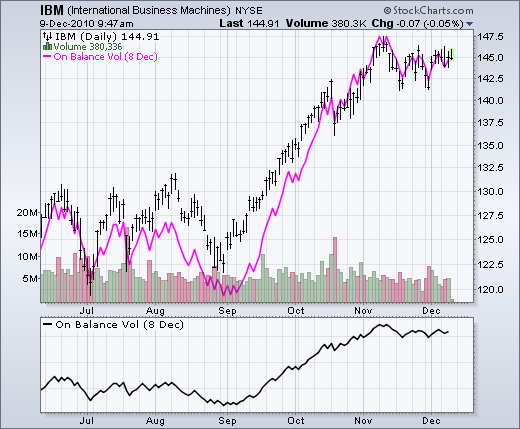
Figure 13.20: On balance volume
Basically, at any point in time, it tells you who, the shorters or longers, has collected the most treasures.
The person that invented this index suggested that volume precedes price. In other words, a change in volume is then followed by a change in price.
Basically, if OBV is rising while prices are either flat or moving down, expect prices to move higher. If OBV is falling while prices are either flat or moving up, expect prices to move lower.
OBV can also be used as signals of trend reversals.
OBV divergence
Rising OBV during a trading range indicates accumulation, which is bullish.
If OBV is trending higher, while price is going down, expect for price to reverse.
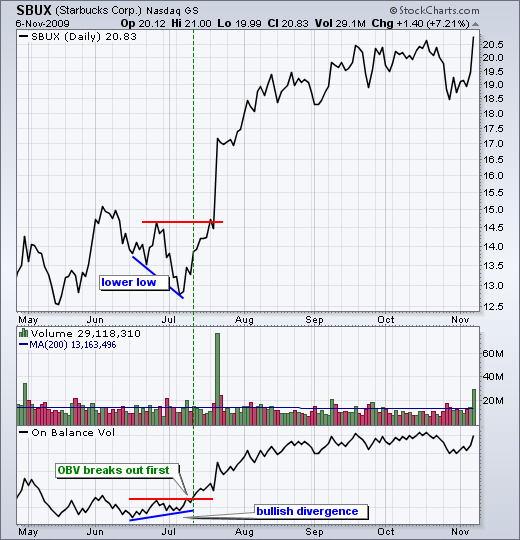
Figure 13.21: On balance volume divergence
In the opposite, if price is rising while OBV is declining, it signals a price decline ahead. Basically, the longers are wining some recent battles but are running low in ammunition.
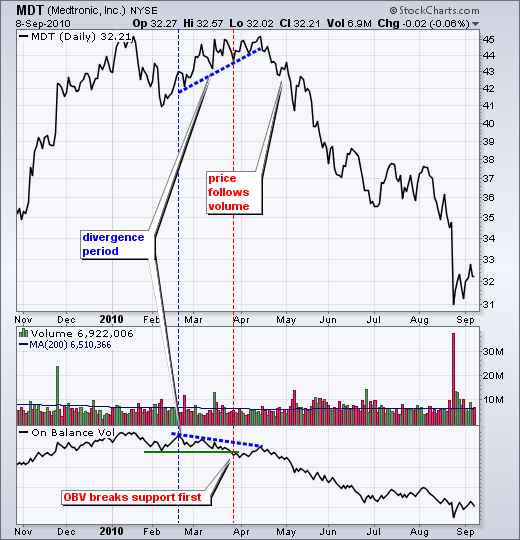
Figure 13.22: On balance volume divergence
OBV trend confirmation
OBV can also be used to confirm a trend. If you expect price to go down, OBV should be going down.
When expecting a trend to go up, OBV should be going up.
So OBV can be used to play safe. Basically, you can look at this indicator and join the team on the lead.
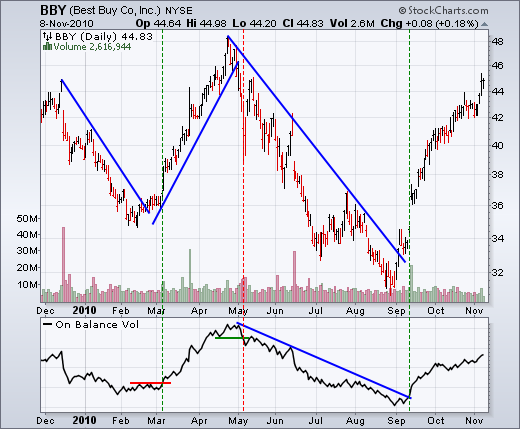
Figure 13.23: On balance volume confirmation