Evening and morning star
Evening star patterns are associated with the top of a price uptrend, signifying that the uptrend is nearing its end.
This pattern includes three candles:
Candle 1: a massive attack by the longers (long bull candle)
Candle 2: a smaller attack by either longers or shorters (a higher, but smaller candle)
Candle 3: a larger counter attack by the shorters (A large non-overlping bear candle)
There is no overlap between the two last attacks, which suggest no counter attacks. According to Bulkowski, 72% of the times, the price will go down.
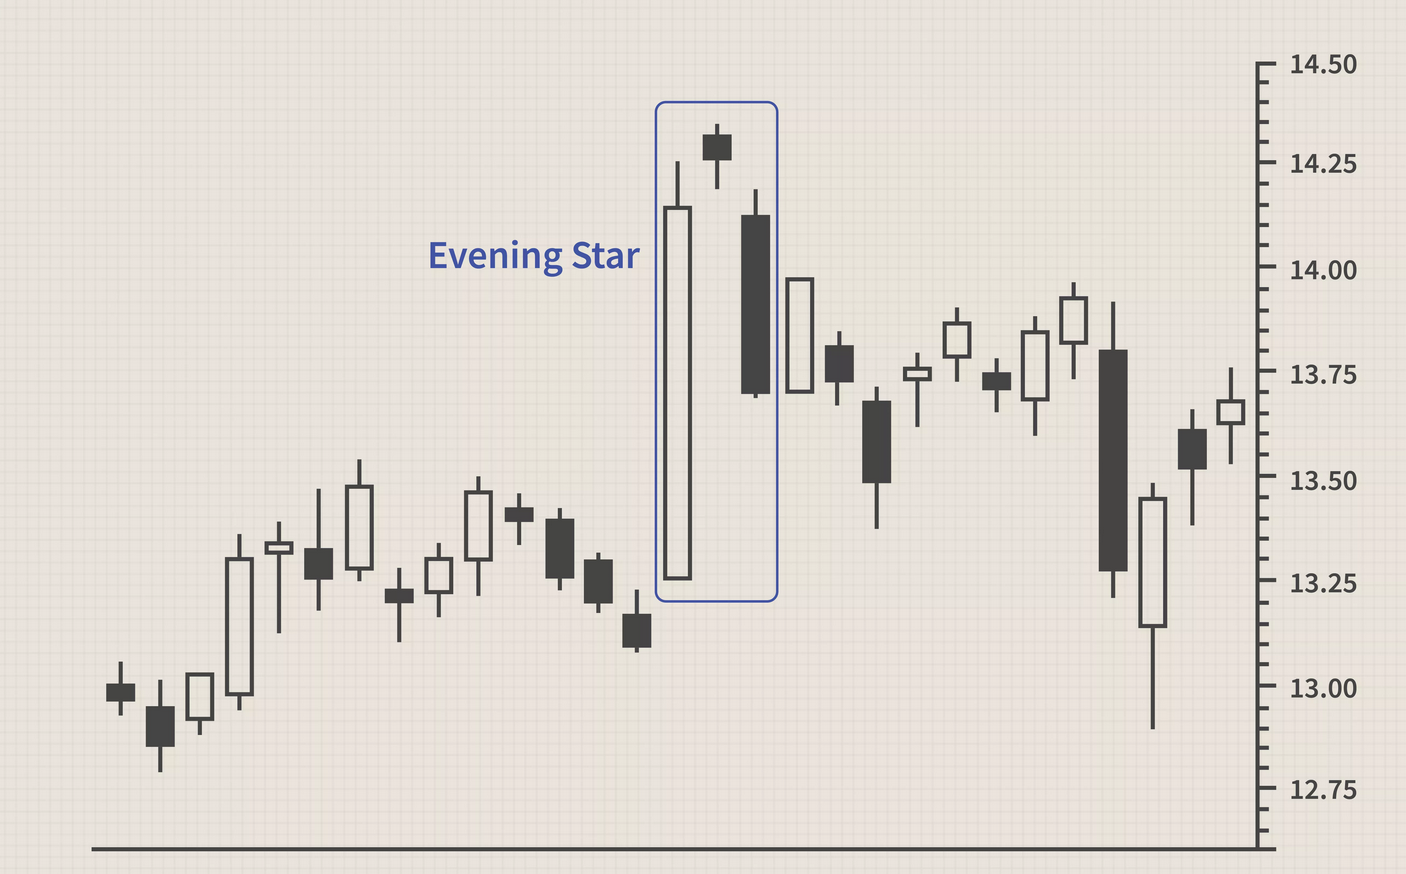
Figure 5.12: Evenin Start on single bull attack
Here is another example showing two consecutive bull attacks.
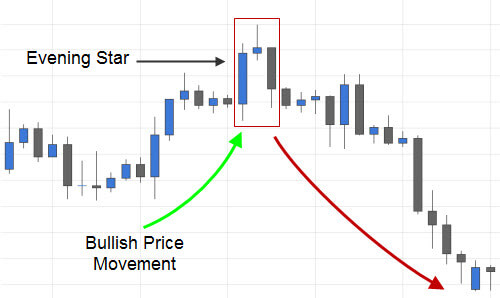
Figure 5.13: Evenin Start on two bull attacks
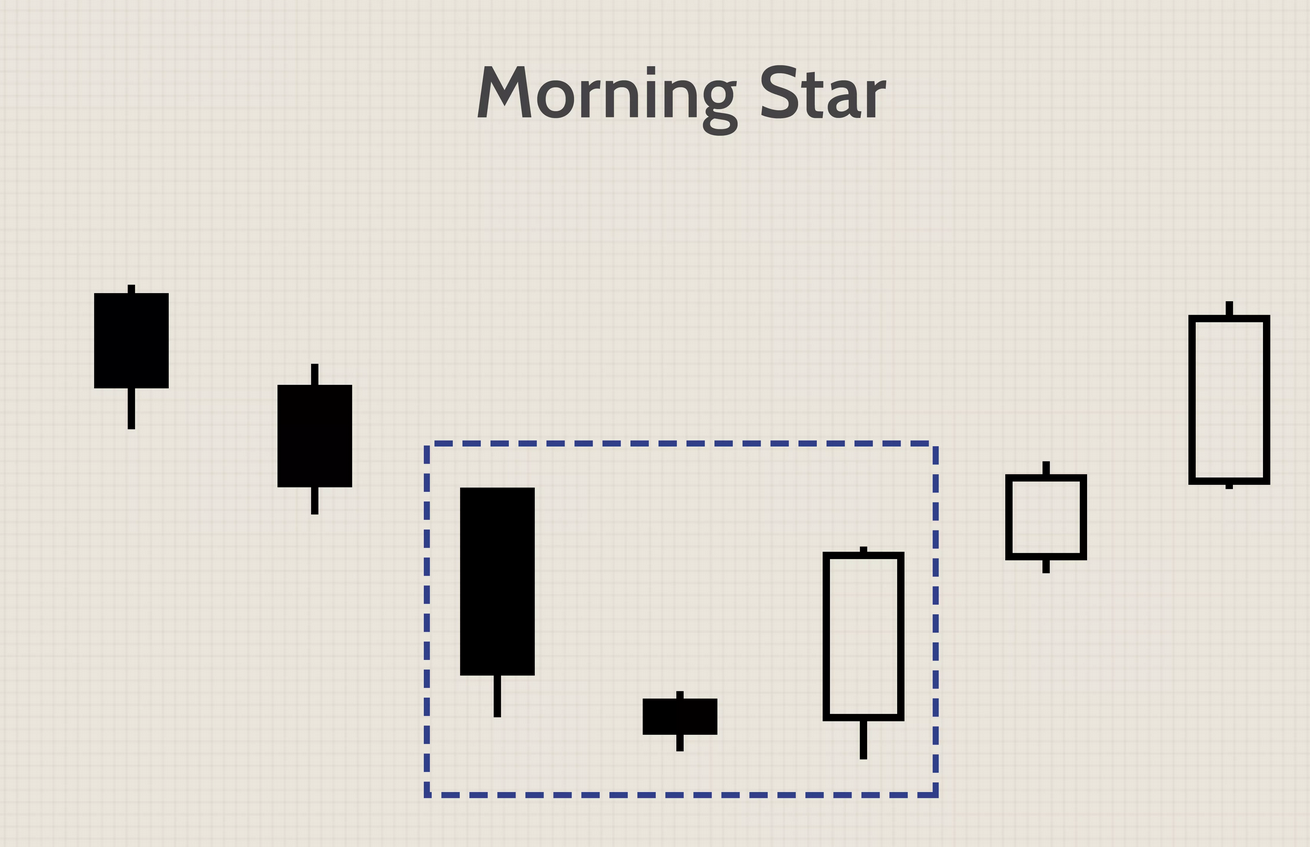
Figure 5.14: Morning start pattern.
Here is an example…
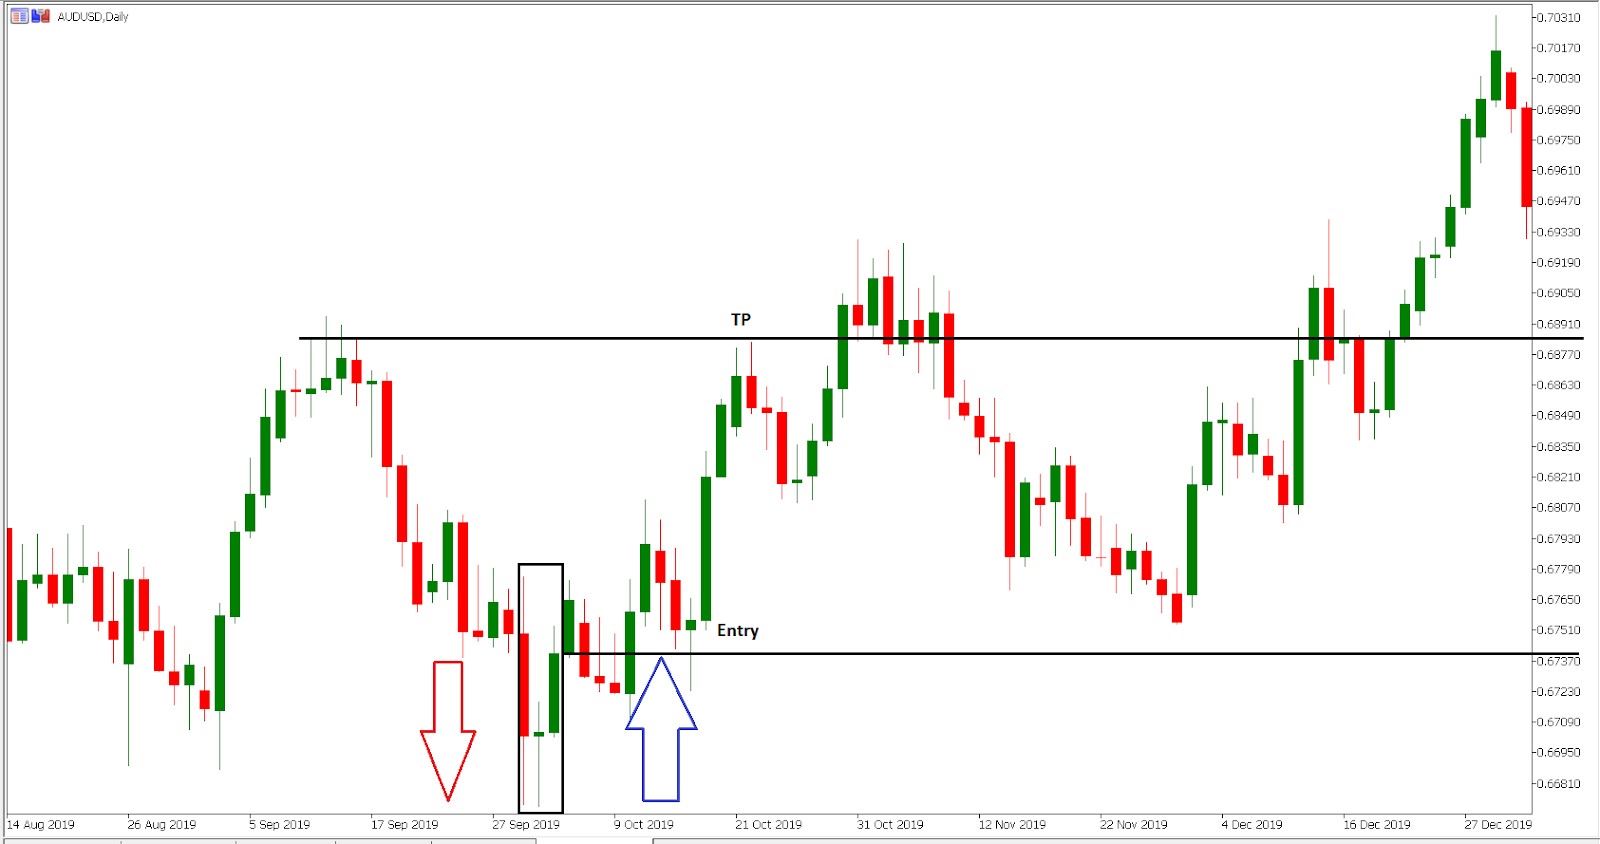
Figure 5.15: Morning start pattern
The starts should be confirmed with the RSI indicators. If a morning start coincides with a low RSI (the stock is oversold), then there is a further confirmation of price reversal.