Broadening pattern
The triangle patterns described above relate to fast counter measures by the oppositie team, which results in increasingly narrower differences between the swing high and lows.
When there is hesitation among the longers and shorters, the difference between the swing highs and lows will get bigger and bigger. Basically, there is a broadening pattern.
If the broadening happens at the peak of a price, it is called broadening tops, and if the broadening happens while the prices are down, it is called a broadening bottom.
When the current price surpasses the line set by the swing highs or lows, it indicates the likely direction of the price breakout.
For instance, in the image below, the price of this stocks enters into a broadening pattern (check how the difference between swign high and lows broadens). The pattern is happening while prices are on the low part, so this is called a “Broadening bottom”,
Now check, how by point 5, the price excess the swings highs. This marks the likely beginning of a bull trend, and it probably signals a good point to buy stock.
Basically, the shorters realize they cannot win the war when the see that despite their efforts, the price moved up. They have to start buying stock to avoid losses. This increase in buying power increases the price.
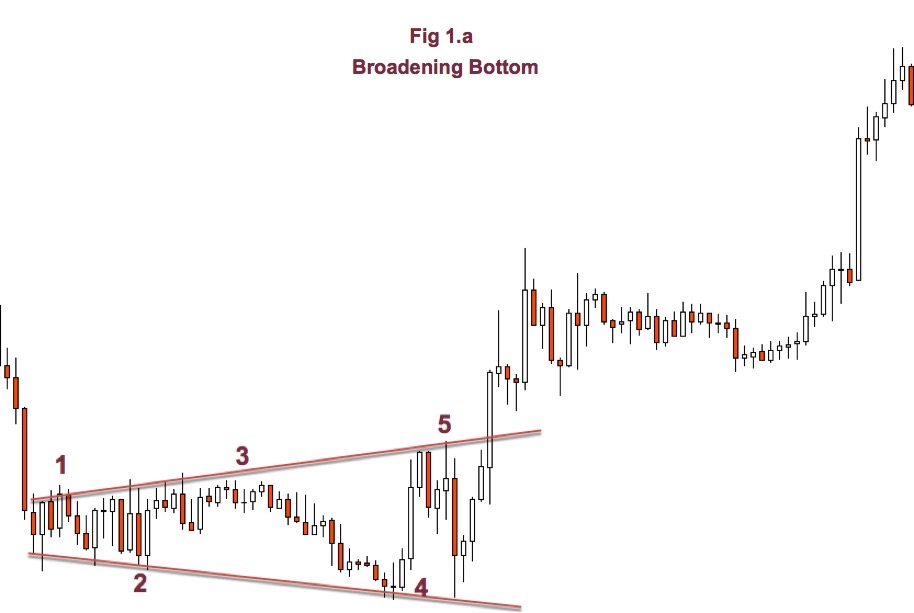
Figure 4.18: Broadening Bottom longers win
Let’s now check the pattern below. A broadening top, in which the shorters win.
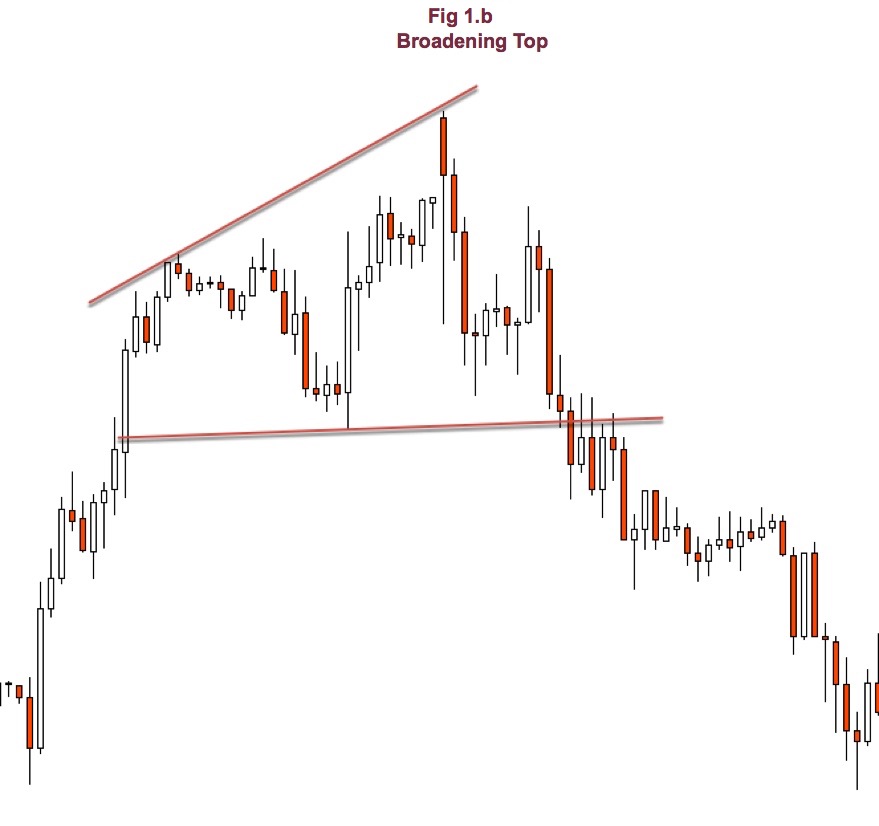
Figure 4.19: Broadening top, shorters win
At times, you could see the broadening patterns, also refereed as triangles…which is similar to the pattern describe earlier.
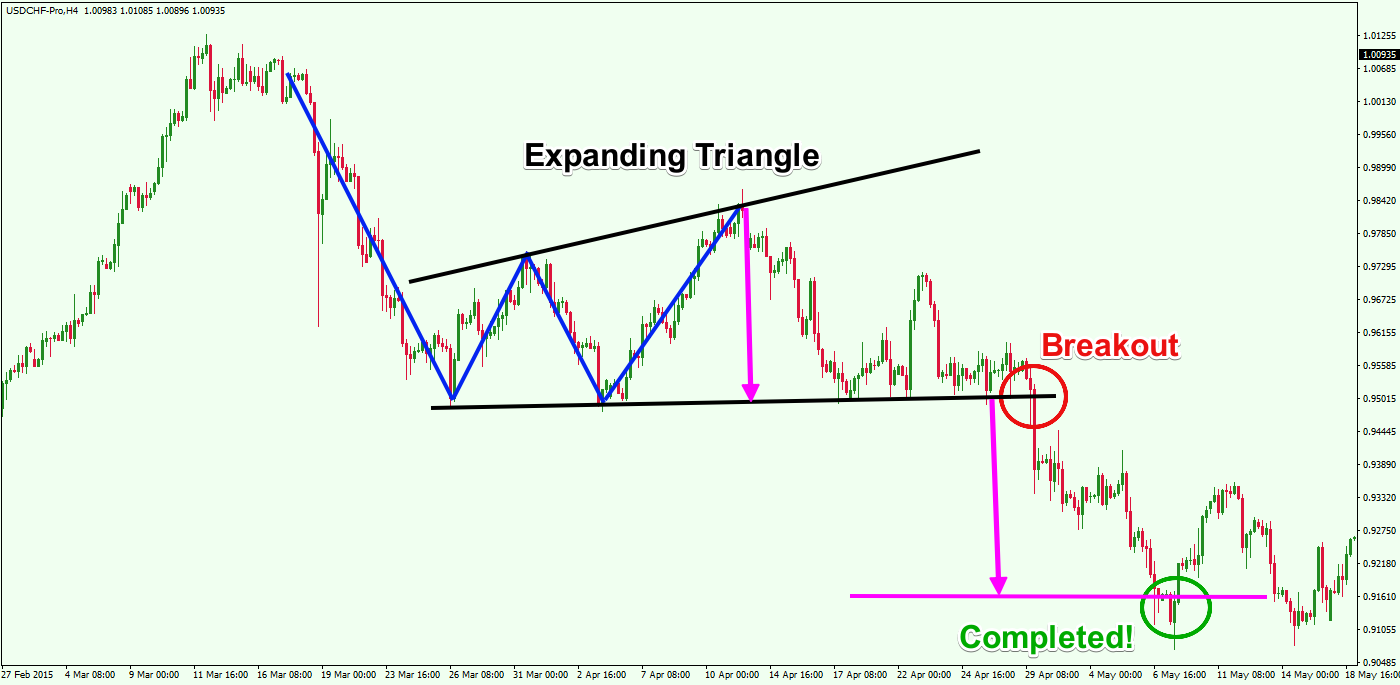
Figure 4.20: Broadening triangle
When the pattern broadens a lot, you could also capitalize by buying at the bottom and selling at the top. Basically, when a price hit a swing low you can buy at that price, and place a profit taker at or just below the prior swing high.
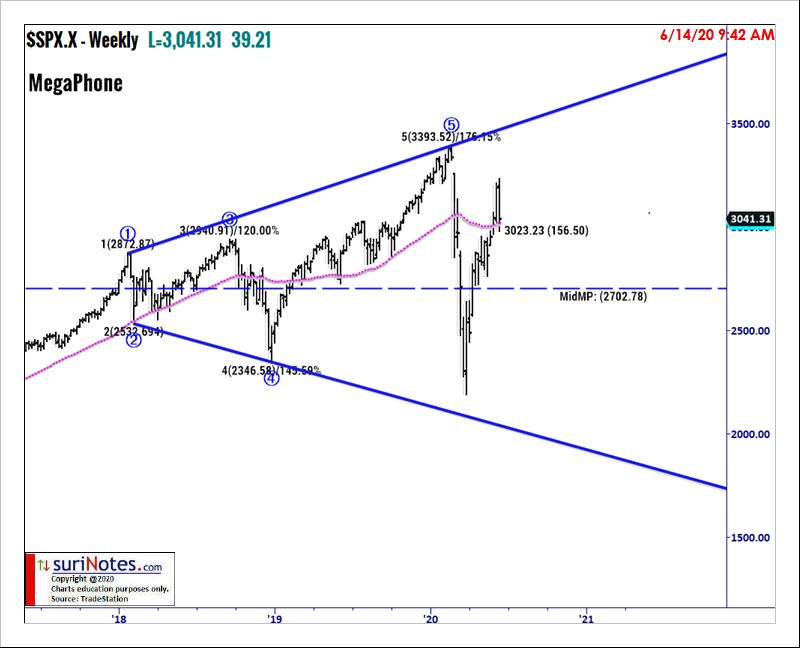
Figure 4.21: Broadening triangle