Earning per Share ratio (EPS)
EPS is simply the earnings (e.g., profits) of a company divided by the outstanding shares of its common stock.
Say a company makes $100 in profits and has 100 shares. Here the EPS of this company is $1.
You could look over time to EPS to see how well a company is doing, or you can compare among companies in the same sector, to see if by comparison the company is doing better or worse.
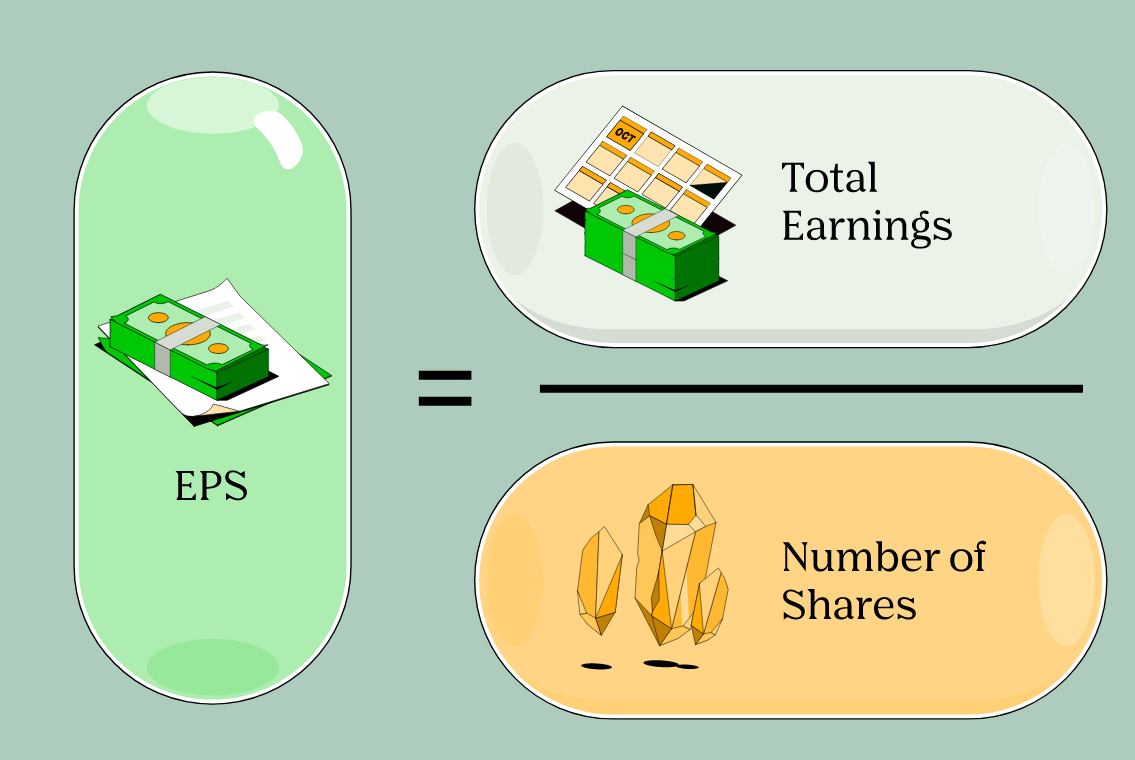
Figure 6.1: EPS
The index could be more precise by adding any diluted shares or preferred dividents [e.g., basically agreements the company has that could be turned into shares (e.g., a debt that can be paid with shares)] leading to:
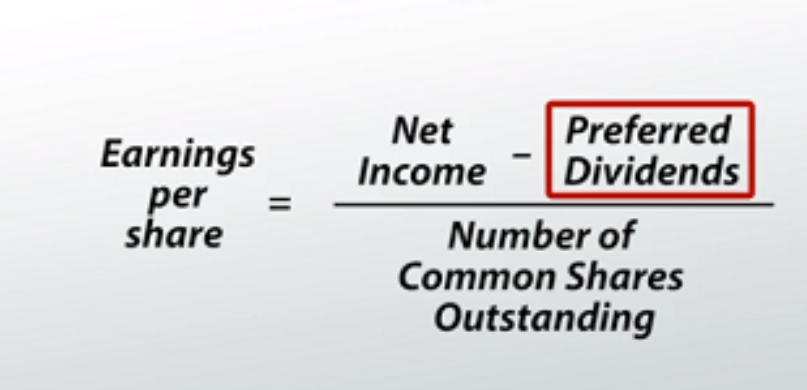
Figure 6.2: EPS
The overall expectation is that if EPS within a company increases, or is higher than other companies in the same sector, the stock price will increase. One would expect traders will be willing to pay more for such a good company.
That conclusion is not bullet proof, price may go up in low or lowers EPS, if on the eyes of analysts, EPS should have been even worse.